WinChart Technical Analysis
Daily Market analysis
| We
are an approved Securities Industry Development Corporation (SIDC)-CPE Training Provider. the training and development arm of the Securities Commission Malaysia (SC). |
|||
 |
 |
||
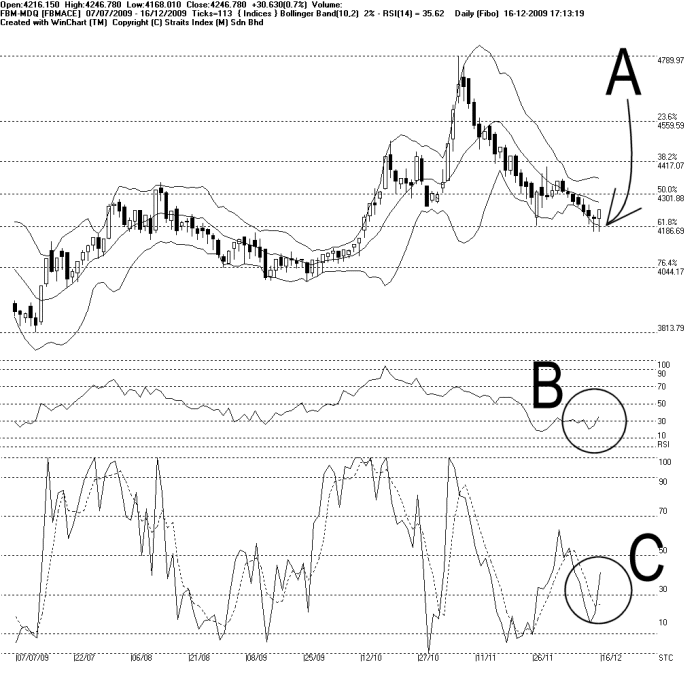
As indicated by A, the FBMACE tested the 4187 WinChart Automatic Fibonacci Retracement, and rebounded on Wednesday, closing 30.63 points or 0.7% higher. Therefore, support for the FBMACE is still at 4187 WinChart Automatic Fibonacci Retracement while the resistance are found in the Bollinger Middle Band dynamic resistance as well as the 4302 WinChart Automatic Fibonacci Retracement.
As shown on the chart above, the Bollinger Bands only expanded 2%, and when compared to the previous two days expansion rate, Wednesday's expansion rate suggests that the Bollinger Bands might contracting, thus the FBMACE is expected to consolidate.
As circled at B, the WinChart RSI rebounded, breaking above 30% level. This is a signal suggesting a technical rebound for the FBMACE, and if the WinChart RSI should continue rising, the rebound of the FBMACE is expected to continue.
As circled at C, the Stochastic also breaks above the 30% level, suggesting a short term technical rebound for the FBMACE. If the Stochastic should also break above 50%, the technical rebound is likely to carry on. However, technically speaking, the Stochastic has to break and maintain above 70% level, in order for the FBMACE to regain its short term bullish position.
Despite improvement signals found in the WinChart RSI and the Stochastic, the FBMACE is still resisted by the Bollinger Middle Band. Therefore, the immediate outlook for the FBMACE is still on the negative side. In short, any rebound below the Bollinger Middle Band could only considered as technical rebound, but not really any bullish signal.
Find this analysis useful? Why not share it with others? Click Here to send this to a friend
 1st Online Training In Malaysia |
 |
 |
 |
| View the Online Training | More Market Analysis | Find out more about WinChart | Upcoming Events |
Straits Index (M)
Sdn Bhd
No. 16, Jalan LP 1A / 5, Lestari Perdana,
43300 Seri Kembangan, Selangor
Hotline: (03) 8941 6828 (5
lines) Fax: (03) 8941 9828
Email: info@straitsindex.com
© Copyright 1997-2009 Straits Index (M) Sdn Bhd All
rights reserved