WinChart Technical Analysis
Daily Market analysis
| We
are an approved Securities Industry Development Corporation (SIDC)-CPE Training Provider. the training and development arm of the Securities Commission Malaysia (SC). |
|||
 |
 |
||
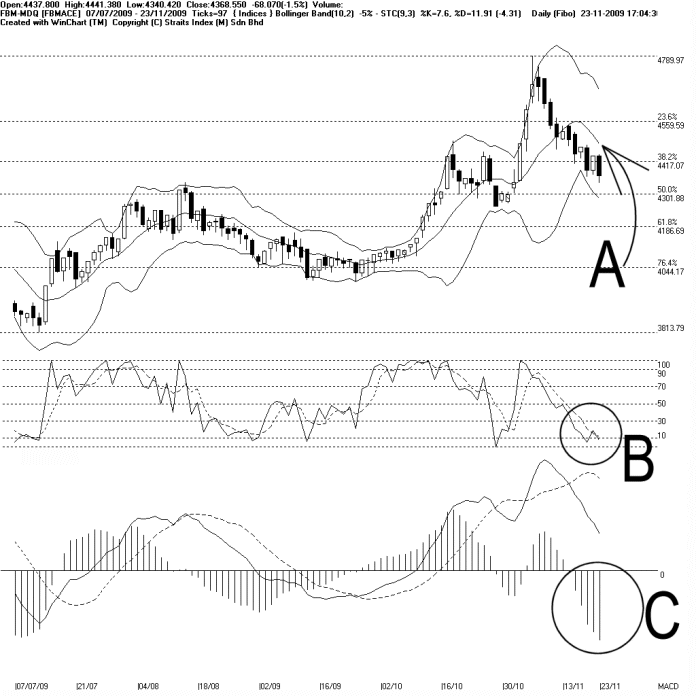
As indicated by A, the FBMACE was resisted by the Bollinger Middle Band on Monday, closing 6807 points or 1.5% lower. This shows that the Bollinger Middle Band is still the dynamic resistance for the FBMACE, other than the 4417 and 4560 WinChart Automatic Fibonacci Retracement. Support for the FBMACE is at 4302 WinChart Automatic Fibonacci Retracement.
As shown on the chart above, despite the FBMACE ended lower, the Bollinger Bands has not re-expanded (contracted 5%). If the Bollinger Bands should continue to contract, there is a chance for the FBMACE to consolidate while avoid forming a downtrend.
As circled at B, the Stochastic is still below 30% level, which is the short term bearish region. Technically, provided that the Stochastic is still below 30% level, the short term movement for the FBMACE is expected to be bearish biased.
As circled at C, the MACD histogram has not formed a Rounding bottom yet, and therefore, the MACD histogram shows no signs of improvement for the FBMACE. If the MACD histogram should form a Rounding Bottom, it would be a signal suggesting that the FBMACE is having a technical rebound or even regaining its strength.
In conclusion, despite the contraction of the Bollinger Bands, the FBMACE is still below the Bollinger Middle Band, and the immediate outlook for the FBMACE is still negative biased. Meanwhile, the FBMACE is now below the 14, 21, 31 EMA, and if the FBMACE should remain below the Bollinger Middle Band as well as the 14, 21, 31 EMA, there is a risk of a downtrend formation.
Find this analysis useful? Why not share it with others? Click Here to send this to a friend
 1st Online Training In Malaysia |
 |
 |
 |
| View the Online Training | More Market Analysis | Find out more about WinChart | Upcoming Events |
Straits Index (M)
Sdn Bhd
No. 16, Jalan LP 1A / 5, Lestari Perdana,
43300 Seri Kembangan, Selangor
Hotline: (03) 8941 6828 (5
lines) Fax: (03) 8941 9828
Email: info@straitsindex.com
© Copyright 1997-2009 Straits Index (M) Sdn Bhd All
rights reserved