WinChart Technical Analysis - Daily Market analysis
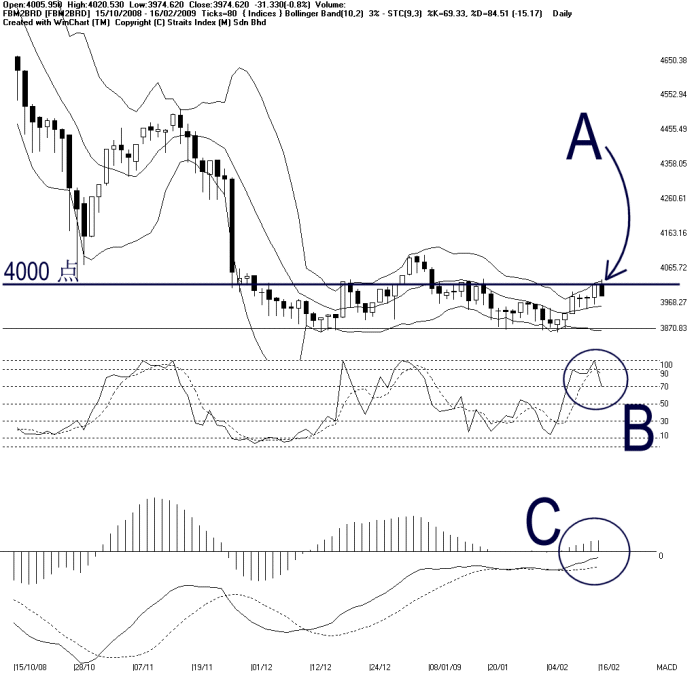
As indicated by A, despite having its daily high at 4020.53 points, the FBM2nd Board Index ended 31.33 points lower to close at 3974.62 points. Therefore, this shows that the 4000 points level is still the resistance for the FBM2nd Board Index.
Meanwhile, the Bollinger Bands Width only expanded 3% on Monday, with the FBM2nd Board Index remain above the Bollinger Middle Band. If the Bollinger Bands Width should begin to contract, it would be a signal suggesting another consolidation for the FBM2nd Board Index.
As circled at B, the Stochastic is still above the 70% level, which is the short term bullish region. If the Stochastic should break below 70% level, it would be a signal suggesting a beginning of a technical correction.
As circled at C, the MACD histogram has not formed a rounding top, suggesting that the FBM2nd Board Index is still gaining strength. However, the MACD line is still below the zero level. This suggests that the mid to longer term movement of the FBM2nd Board Index is still on the weaker side.
Find this analysis useful? Why not share it with others? Click Here to send this to a friend
 1st Online Training In Malaysia |
 |
 |
 |
| View the Online Training | More Market Analysis | Find out more about WinChart | Upcoming Events |
Straits Index (M)
Sdn Bhd
No. 16, Jalan LP 1A / 5, Lestari Perdana,
43300 Seri Kembangan, Selangor
Hotline: (03) 8941 6828 (5
lines) Fax: (03) 8941 9828
Email: info@straitsindex.com
© Copyright 1997-2007 Straits Index (M) Sdn Bhd All
rights reserved