WinChart Technical Analysis - Daily Market analysis

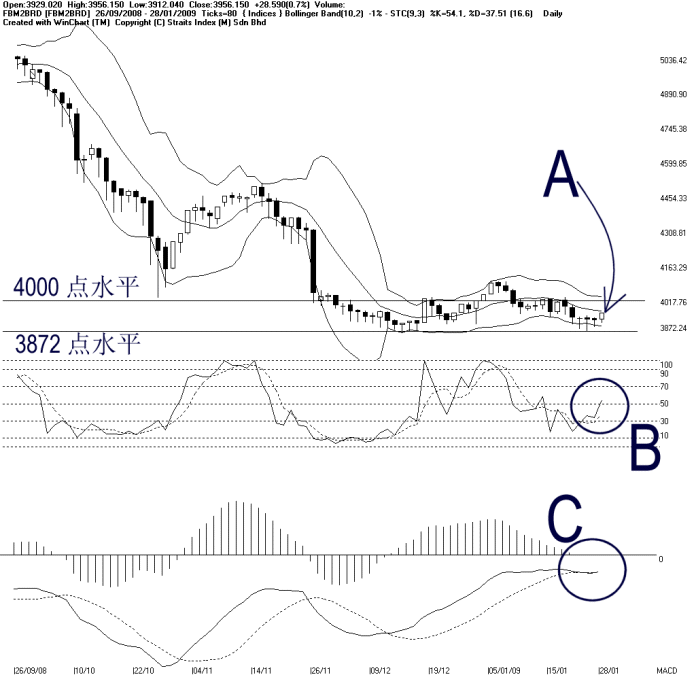
As indicated by A, the FBM2nd Board Index technically rebounded 28.59 points or 0.7% to close at 3956.15 points on Wednesday. The FBM2nd Board Index is set to test the Bollinger Middle Band dynamic resistance, and if the FBM2nd Board Index could break above the Bollinger Middle Band, the immediate outlook for the FBM2nd Board Index would turn to bullish biased. But still, we have to wait until the Bollinger Bands Width expands with the movement signal. Next resistance for the FBM2nd Board Index is seen at 4000 level, while the support is still at 3872.24 WinChart Automatic Fibonacci Retracement.
As circled at B, the Stochastic also rebounded on Wednesday, breaking slightly above the 50% level, suggesting a beginning of a technical rebound signal. If the Stochastic should also break above the 70% level, it would be a short term bullish signal for the FBM2nd Board Index. Of course, the Stochastic would have to remain above the 70% level in order to sustain the short term bullish signal.
As circled at C, the MACD line stop declining, and therefore, we shall watch out for any rounding bottom formation from the MACD histogram. If the the MACD histogram should form a rounding bottom, it would be a signal suggesting that the FBM2nd Board Index is regaining its strength. Nevertheless, with the MACD line still below the zero line, it suggests that the mid to long term movement of the FBM2nd Board Index is still on the weaker side.
Find this analysis useful? Why not share it with others? Click Here to send this to a friend
 1st Online Training In Malaysia |
 |
 |
 |
| View the Online Training | More Market Analysis | Find out more about WinChart | Upcoming Events |
Straits Index (M)
Sdn Bhd
No. 16, Jalan LP 1A / 5, Lestari Perdana,
43300 Seri Kembangan, Selangor
Hotline: (03) 8941 6828 (5
lines) Fax: (03) 8941 9828
Email: info@straitsindex.com
© Copyright 1997-2007 Straits Index (M) Sdn Bhd All
rights reserved