WinChart Technical Analysis - Daily Market analysis

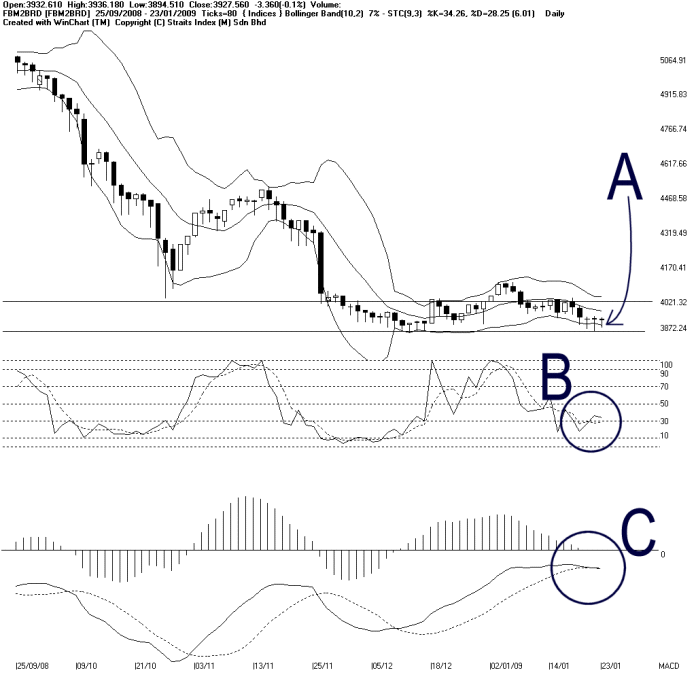
As indicated by A, the FBM2nd Board Index ended sideways again on Friday, closing 3.36 points lower to 3927.56 points. Support for the FBM2nd Board Index is still at 3872.24 WinChart Automatic Fibonacci Retracement while the resistance remains at 4000 level, as well as the Bollinger Middle Band dynamic resistance.
As shown on the chart, the Bollinger Bands Width expanded 7% on Friday, with the FBM2nd Board Index below the Bollinger Middle Band. However, the expansion of the Bollinger Bands Width was not significant, and therefore, it is still now showing any direction for the FBM2nd Board Index. Nonetheless, since the FBM2nd Board Index is still below the Bollinger Middle Band, the immediate outlook for the FBM2nd Board Index is still bearish biased.
As circled at B, the Stochastic did not break above the 50% level and started falling on Friday, suggesting that the short term movement of the FBM2nd Board Index is still not improving. This is because the FBM2nd Board Index is still consolidating in its sideways movement.
As circled at C, no rounding bottom is sighted yet from the MACD histogram, and therefore, no sign of regaining strength is seen for the FBM2nd Board Index yet. Meanwhile, with the MACD line below the zero and started falling, the medium to longer term movement of the FBM2nd Board Index is still on the weaker side.
Find this analysis useful? Why not share it with others? Click Here to send this to a friend
 1st Online Training In Malaysia |
 |
 |
 |
| View the Online Training | More Market Analysis | Find out more about WinChart | Upcoming Events |
Straits Index (M)
Sdn Bhd
No. 16, Jalan LP 1A / 5, Lestari Perdana,
43300 Seri Kembangan, Selangor
Hotline: (03) 8941 6828 (5
lines) Fax: (03) 8941 9828
Email: info@straitsindex.com
© Copyright 1997-2007 Straits Index (M) Sdn Bhd All
rights reserved