Winchart Technical Analysis - Daily Market analysis

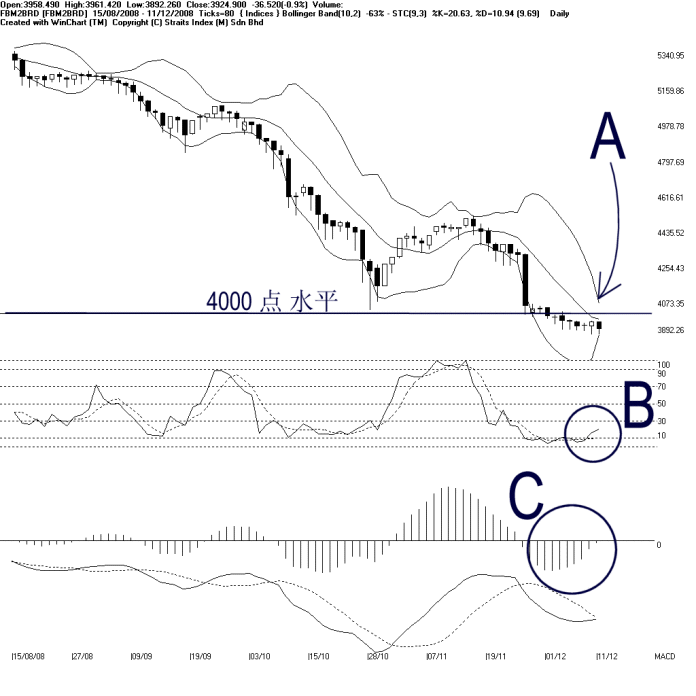
As shown on the chart above, the FBM2nd Board Index had been consolidating for two weeks in narrow range, and as a result, the Bollinger Bands Width contracted significantly. As indicated by A, generally, if the Bollinger Bands Width has contracted significantly, it implies that the consolidation is near its end, and the FBM2nd Board Index is about have a new movement. Of course, we will still have to wait until the Bollinger Bands Width expands to determine the direction of the new movement. Meanwhile, the Bollinger Middle Band remains the dynamic resistance, while the 4000 points is still the resistance for the FBM2nd Board Index.
As circled at B, although the Stochastic is rising slowly, it is still below the 30% level, and therefore, this shows that the market movement for the short term is still bearish biased, unless the Stochastic could break above the 30% level successfully.
As circled at C, the MACD histogram is still rising steadily while the rounding bottom remains intact. This suggests that the FBM2nd Board Index is still consolidating. However, as a note of caution, with the MACD line is still below the zero level, the market movement for the mid to longer view is still weak.
Find this analysis useful? Why not share it with others? Click Here to send this to a friend
 1st Online Training In Malaysia |
 |
 |
 |
| View the Online Training | More Market Analysis | Find out more about WinChart | Upcoming Events |
Straits Index (M)
Sdn Bhd
No. 16, Jalan LP 1A / 5, Lestari Perdana,
43300 Seri Kembangan, Selangor
Hotline: (03) 8941 6828 (5
lines) Fax: (03) 8941 9828
Email: info@straitsindex.com
© Copyright 1997-2007 Straits Index (M) Sdn Bhd All
rights reserved