Winchart Technical Analysis - Daily Market analysis

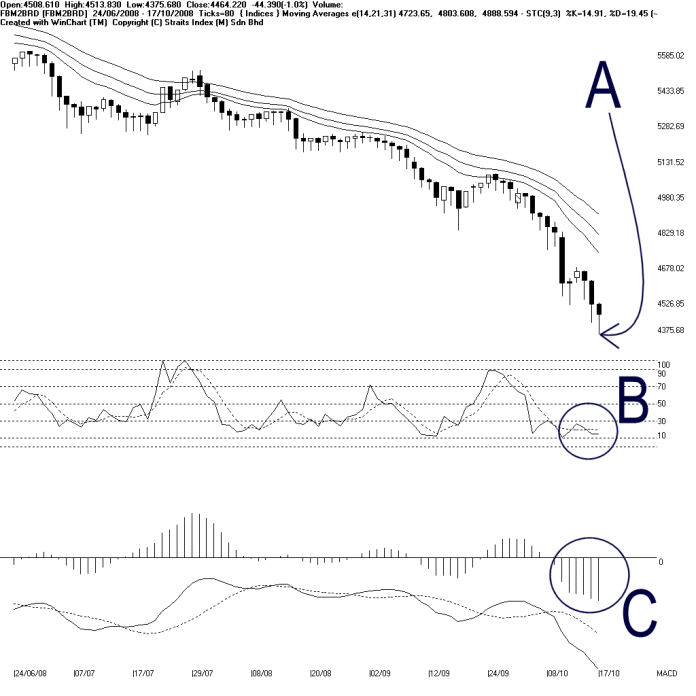
As indicated by A, the FBM2nd Board Index marks another new low with 4375.68 points before closing at 4464.22 points, down 44.39 points. Therefore, there is no reliable support level for the FBM2nd Board Index for the time being. However, as shown on the chart, the 14, 21, 31 EMA is still serving as the dynamic resistance for the FBM2nd Board Index, and therefore, the downtrend remains intact, and the outlook for the FBM2nd Board Index is still bearish biased.
As circled at B, the Stochastic is still below the 30% level, the short term bearish region. This shows that the FBM2nd Board Index short term movement is indeed bearish, and the bearish biased movement is expected to continue until the Stochastic should break out successfully above 30% level. If the Stochastic should break above 30% level, it would be a signal of a beginning of technical rebound.
As circled at C, the MACD histogram is still falling, suggesting the FBM2nd Board Index is still turning weaker. If the MACD histogram should tick up and form a rounding bottom, it would be a signal suggesting a consolidation for the FBM2nd Board Index.
Find this analysis useful? Why not share it with others? Click Here to send this to a friend
 1st Online Training In Malaysia |
 |
 |
 |
| View the Online Training | More Market Analysis | Find out more about WinChart | Upcoming Events |
Straits Index (M)
Sdn Bhd
No. 16, Jalan LP 1A / 5, Lestari Perdana,
43300 Seri Kembangan, Selangor
Hotline: (03) 8941 6828 (5
lines) Fax: (03) 8941 9828
Email: info@straitsindex.com
© Copyright 1997-2007 Straits Index (M) Sdn Bhd All
rights reserved