Winchart Technical Analysis - Daily Market analysis

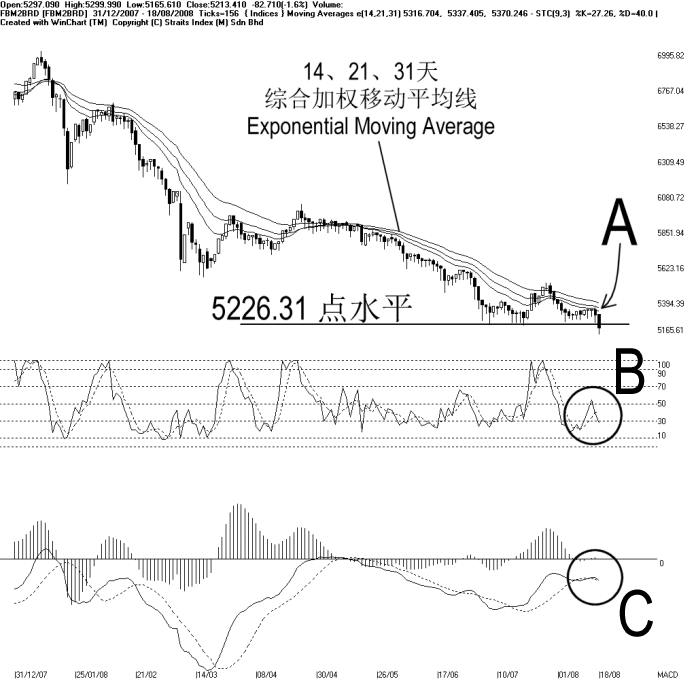
On Monday, the FBM2nd Board Index break below the 5226.31 support level, and therefore, failing to form a double bottom. Meanwhile, as indicated by A, the 14, 21, 31 EMA dynamic resistance remains intact, and therefore, the outlook for the FBM2nd Board Index is still bearish biased. Since the FBM2nd Board Index is at new low again, there is no support for the FBM2nd Board Index until a consolidation or a rebound.
As circled at B, the Stochastic %K line fall below the 30% level slightly, if the Stochastic %D line should also breaking below the 30% level, it would confirm the short term bearish signal for the FBM2nd Board Index, and the market movement for the short term shall continue to stay bearish biased.
As circled at C, the MACD failed to break above the zero level, suggesting the mid to longer movement for the FBM2nd Board Index is still negative. If the MACD should start falling again, it would suggests that the FBM2nd Board Index resumes its downtrend until a rounding bottom is seen at the MACD histogram.
In conclusion, the new low for FBM2nd Board Index ended its consolidation which lasted for two weeks, and the FBM2nd Board Index is now set to resume its downtrend.
Find this analysis useful? Why not share it with others? Click Here to send this to a friend
 1st Online Training In Malaysia |
 |
 |
 |
| View the Online Training | More Market Analysis | Find out more about WinChart | Upcoming Events |
Straits Index (M)
Sdn Bhd
No. 16, Jalan LP 1A / 5, Lestari Perdana,
43300 Seri Kembangan, Selangor
Hotline: (03) 8941 6828 (5
lines) Fax: (03) 8941 9828
Email: info@straitsindex.com
© Copyright 1997-2007 Straits Index (M) Sdn Bhd All
rights reserved