Winchart Technical Analysis - Daily Market analysis

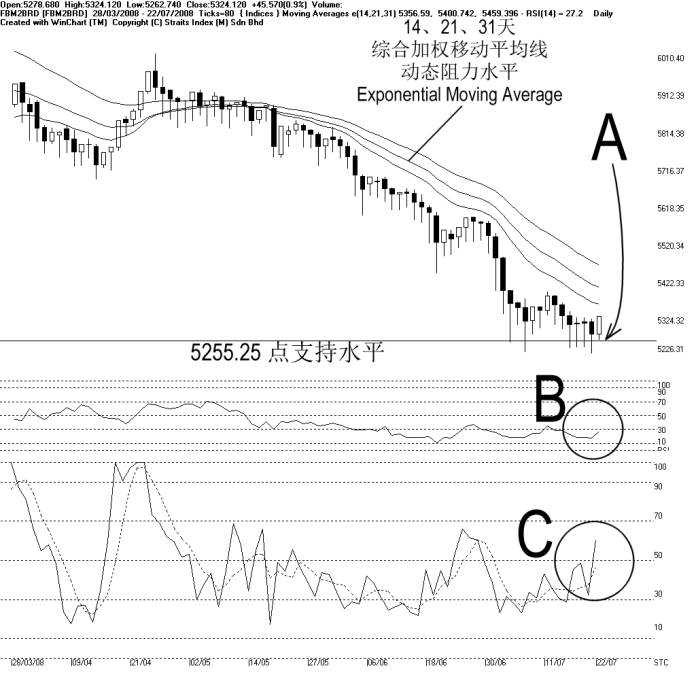
As indicated by A, the FBM2nd Board Index rebound after precisely supported by the 5255.25 level. The FBM2nd Board Index closed 45.57 points higher on Tuesday, and now is set to test the 14, 21, 31 EMA dynamic resistance. If the FBM2nd Board Index could break above the 14, 21, 31 EMA, it would end the downtrend. However, if the FBM2nd Board Index should retreat again after hitting the dynamic resistance, the downtrend shall continue.
As circled at B, the WinChart RSI rises as the FBM2nd Board Index rebound. If the WinChart RSI should break above the 30% level, it would end the mid term bearish signal, and the market sentiment for the mid term would turn from bearish biased to neutral.
As circled at C, the Stochastic did not break below the 30% level, and therefore, the short term neutral signal remains intact. If the Stochastic should break above the 70% level, it would suggests a short term bullish signal, and the market movement for the short term is expected to improve.
Find this analysis useful? Why not share it with others? Click Here to send this to a friend
 1st Online Training In Malaysia |
 |
 |
 |
| View the Online Training | More Market Analysis | Find out more about WinChart | Upcoming Events |
Straits Index (M)
Sdn Bhd
No. 16, Jalan LP 1A / 5, Lestari Perdana,
43300 Seri Kembangan, Selangor
Hotline: (03) 8941 6828 (5
lines) Fax: (03) 8941 9828
Email: info@straitsindex.com
© Copyright 1997-2007 Straits Index (M) Sdn Bhd All
rights reserved