Winchart Technical Analysis - Daily Market analysis

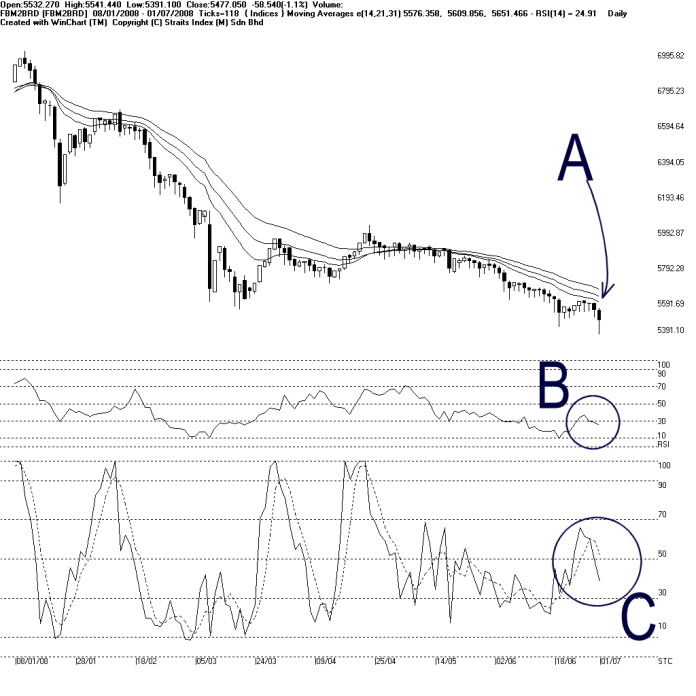
On Tuesday, the FBM2nd Board Index had its daily low touching 5391.10 point, which marked another new low, before rebound slightly to close at 5477.05 points. Despite the rebound, the FBM2nd Board Index remains resisted by the descending 14, 21, 31 EMA, which is the dynamic resistance for the FBM2nd Board Index. Therefore, the downtrend for the FBM2nd Board Index remains intact. Since the FBM2nd Board Index is making a new low again, there is no reliable support for this moment.
As circled at B, the WinChart RSI continued falling, while staying below the 30% level, which is the mid term bearish region. Therefore, this suggests that the market sentiment for the mid term is still negative biased.
As circled at C, the Stochastic stays in the short term neutral region, suggesting that the current short term movement for the FBM2nd Board Index is still at neutral. However, it is important to know that the Stochastic is a highly sensitive technical indicator. Therefore, if the FBM2nd Board Index should close lower and towards its daily low again in the coming trading days, the Stochastic would break below the 30% level, and trigger a short term bearish signal.
Find this analysis useful? Why not share it with others? Click Here to send this to a friend
 1st Online Training In Malaysia |
 |
 |
 |
| View the Online Training | More Market Analysis | Find out more about WinChart | Upcoming Events |
Straits Index (M)
Sdn Bhd
No. 16, Jalan LP 1A / 5, Lestari Perdana,
43300 Seri Kembangan, Selangor
Hotline: (03) 8941 6828 (5
lines) Fax: (03) 8941 9828
Email: info@straitsindex.com
© Copyright 1997-2007 Straits Index (M) Sdn Bhd All
rights reserved