Winchart Technical Analysis - Daily Market analysis

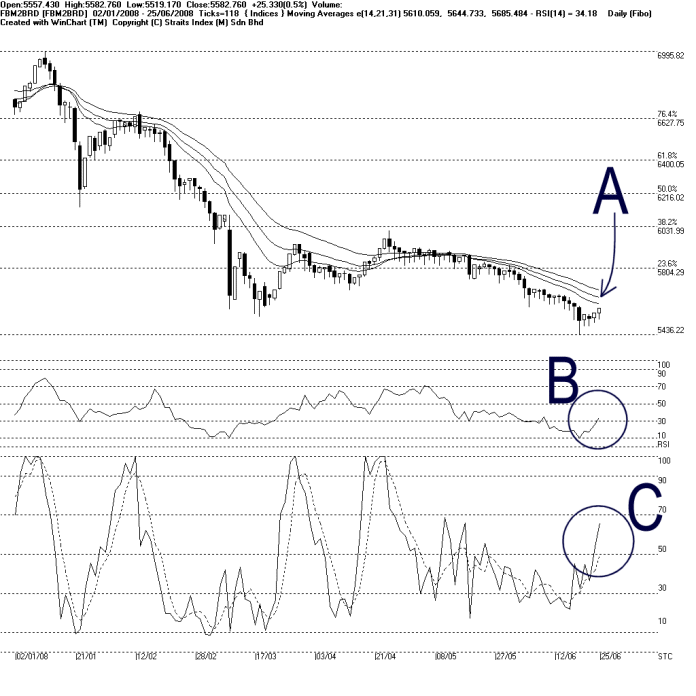
On Wednesday, the FBM2nd Board Index continued its technical rebound, closing at its daily high at 5582.76 point, up 25.33 points. As indicated by A, the FBM2nd Board Index is set to test the 14, 21, 31 EMA dynamic resistance. If the FBM2nd Board Index could break above the dynamic resistance successfully, it would mark an end to this downtrend. However, if the FBM2nd Board Index should remain resisted by the falling dynamic resistance, it would suggests that the technical rebound has ended, and the downtrend shall continue. Nevertheless, support for the FBM2nd Board Index is still at 5436.22 Fibonacci Retracement line.
As circled at B, the WinChart RSI breaks above the 30% marginally on Wednesday. This suggests some improvement in the mid term market sentiment as the WinChart RSI is now breaking away from the bearish region to the neutral region. In other words, if the WinChart RSI should remain above the 30% level, the FBM2nd Board Index is likely to consolidate.
In line with the technical rebound, the Stochastic also rises on Wednesday while staying in the short term neutral region. If the Stochastic should break above the 70% level, it would be a short term bullish signal. However, the Stochastic must maintain its position above the 70% level in order to sustain the short term bullishness.
Find this analysis useful? Why not share it with others? Click Here to send this to a friend
 1st Online Training In Malaysia |
 |
 |
 |
| View the Online Training | More Market Analysis | Find out more about WinChart | Upcoming Events |
Straits Index (M)
Sdn Bhd
No. 16, Jalan LP 1A / 5, Lestari Perdana,
43300 Seri Kembangan, Selangor
Hotline: (03) 8941 6828 (5
lines) Fax: (03) 8941 9828
Email: info@straitsindex.com
© Copyright 1997-2007 Straits Index (M) Sdn Bhd All
rights reserved