Winchart Technical Analysis - Daily Market analysis

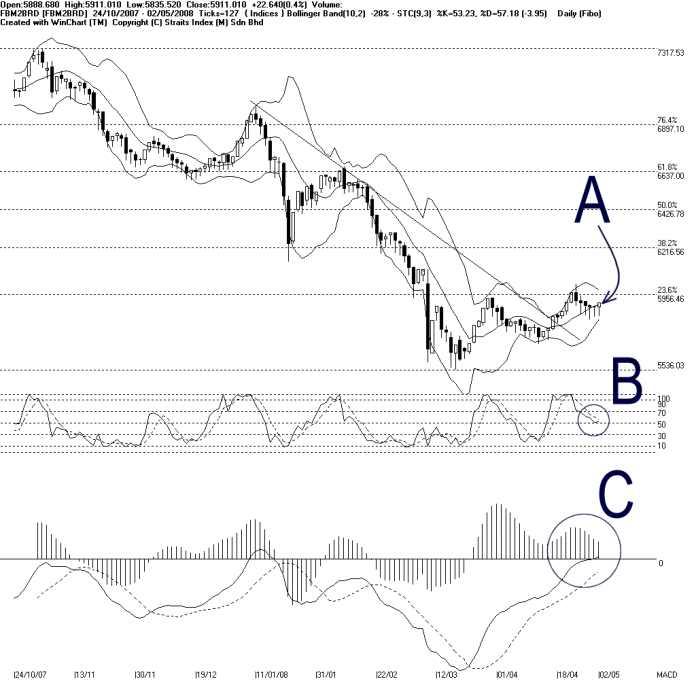
On Friday, the Bollinger Bands Width of the FBM2nd Board Index contracted another 28%, suggesting that the FBM2nd Board Index is still consolidating. Meanwhile, as indicated by A, the FBM2nd Board Index is still supported by the Bollinger Middle Band. Therefore, if the Bollinger Bands Width should expand again with the FBM2nd Board Index staying above the Bollinger Middle Band, it would be another bullish signal for the FBM2nd Board Index, and the FBM2nd Board Index is set to retest the 5956 level.
As circled at B, the Stochastic is still staying around the 50% level, which is the short term neutral region. Therefore, the Stochastic is suggesting a short term neutral movement. If the Stochastic should break above the 70% level, it would be another short term bullish signal for the FBM2nd Board Index.
As circled at C, the MACD histogram is still falling, and therefore, the rounding top is still visible, suggesting that the FBM2nd Board Index is still weakening. Nevertheless, if the MACD histogram should tick up and form a rounding bottom, it would be a signal suggesting a continuation of the MACD Bullish signal, for the MACD line is still staying above the trigger line.
Find this analysis useful? Why not share it with others? Click Here to send this to a friend
 1st Online Training In Malaysia |
 |
 |
 |
| View the Online Training | More Market Analysis | Find out more about WinChart | Upcoming Events |
Straits Index (M)
Sdn Bhd
No. 16, Jalan LP 1A / 5, Lestari Perdana,
43300 Seri Kembangan, Selangor
Hotline: (03) 8941 6828 (5
lines) Fax: (03) 8941 9828
Email: info@straitsindex.com
© Copyright 1997-2007 Straits Index (M) Sdn Bhd All
rights reserved