Winchart Technical Analysis - Daily Market analysis

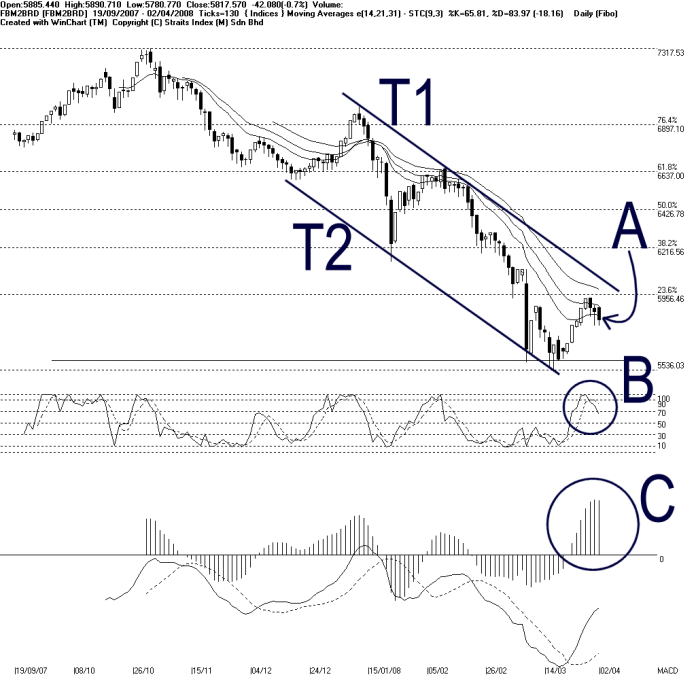
Despite the strong gain of the Dow Jones Industrial Average, the FBM2nd Board Index ended 42.08 points lower on Wednesday to close at 5817.57 points. As indicated by A, the FBM2nd Board Index is still resisted by the 14, 21, 31 EMA, and the T1 and T2 downtrend channel remains intact. Nevertheless, support for the FBM2nd Board Index is still seen at 5577 level.
As circled at B, the Stochastic %K line fall below the 70% level marginally on Wednesday. If the Stochastic %D line should also break below the 70% level, it would mark an end to the short term bullish signal, and the market movement for the short term would turn from bullish biased to neutral.
As circled at C, the MACD histogram turned lower on Wednesday, and therefore, there is a sign of a rounding top formation. If the MACD histogram should form a rounding top, it would suggests that the FBM2nd Board Index is weakening.
Find this analysis useful? Why not share it with others? Click Here to send this to a friend
 1st Online Training In Malaysia |
 |
 |
 |
| View the Online Training | More Market Analysis | Find out more about WinChart | Upcoming Events |
Straits Index (M)
Sdn Bhd
No. 16, Jalan LP 1A / 5, Lestari Perdana,
43300 Seri Kembangan, Selangor
Hotline: (03) 8941 6828 (5
lines) Fax: (03) 8941 9828
Email: info@straitsindex.com
© Copyright 1997-2007 Straits Index (M) Sdn Bhd All
rights reserved