Winchart Technical Analysis - Daily Market analysis

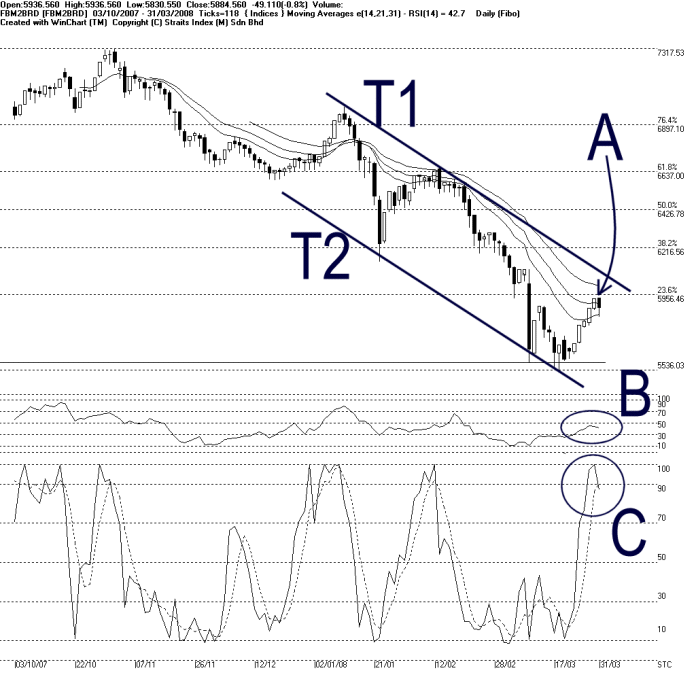
On Monday, the FBM2nd Board Index retreated 49.11 point after rising for 1 whole week last week. As indicated by A, the FBM2nd Board Index is now resisted by the 5956 WinChart Automatic Fibonacci Retracement line, and stays in the 14, 21, 31 EMA congestion zone. With the T1 and T2 downtrend channel remains intact, the longer term outlook for the FBM2nd Board Index shall remains bearish biased.
As circled at B, the WinChart RSI is still moving sideways below the 50% level, which is the mid term neutral region. Therefore, the WinChart RSI is still suggesting a mid term neutral sentiment for the FBM2nd Board Index.
As circled at C, the Stochastic retreated after hitting above 90% level. The retreat of the FBM2nd Board Index on Monday is also a form a technical correction after the FBM2nd Board Index has gone over-bought as suggested by the Stochastic. Nevertheless, provided that the Stochastic could maintain above the 70% level, the short term movement for the FBM2nd Board Index is still bullish biased.
Find this analysis useful? Why not share it with others? Click Here to send this to a friend
 1st Online Training In Malaysia |
 |
 |
 |
| View the Online Training | More Market Analysis | Find out more about WinChart | Upcoming Events |
Straits Index (M)
Sdn Bhd
No. 16, Jalan LP 1A / 5, Lestari Perdana,
43300 Seri Kembangan, Selangor
Hotline: (03) 8941 6828 (5
lines) Fax: (03) 8941 9828
Email: info@straitsindex.com
© Copyright 1997-2007 Straits Index (M) Sdn Bhd All
rights reserved