Winchart Technical Analysis - Daily Market analysis

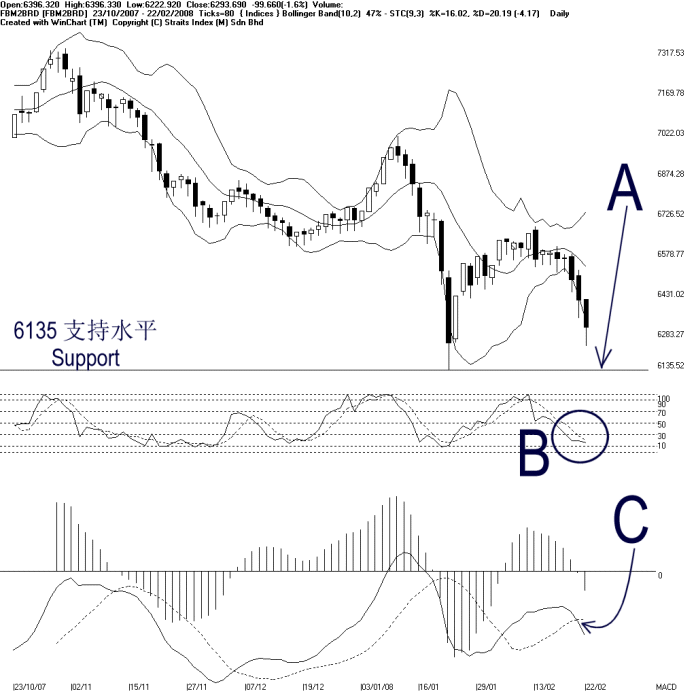
On Friday, the FBM2nd Board Index ended another 99.66 points lower to 6293.69 points as the Bollinger Bands Width continue to expand. As indicated by A, the FBM2nd Board Index is now testing the 6135 support level, and if the FBM2nd Board Index should rebound from the support, there will be a chance for the FBM2nd Board Index to consolidate. However, as long as the FBM2nd Board Index is still staying below the Bollinger Middle Band, which is also the dynamic resistance, the outlook for the FBM2nd Board Index is still bearish biased.
As circled at B, the Stochastic is still staying below the 30% level, which is the short term bearish region. Therefore, the Stochastic is still suggesting a short term bearish biased signal for the FBM2nd Board Index.
As indicated by C, the MACD line crosses below the trigger line, triggering a bearish signal. Meanwhile, the MACD histogram is still falling, suggesting that the current movement for the FBM2nd Board Index is still weakening.
Find this analysis useful? Why not share it with others? Click Here to send this to a friend
 1st Online Training In Malaysia |
 |
 |
 |
| View the Online Training | More Market Analysis | Find out more about WinChart | Upcoming Events |
Straits Index (M)
Sdn Bhd
No. 16, Jalan LP 1A / 5, Lestari Perdana,
43300 Seri Kembangan, Selangor
Hotline: (03) 8941 6828 (5
lines) Fax: (03) 8941 9828
Email: info@straitsindex.com
© Copyright 1997-2007 Straits Index (M) Sdn Bhd All
rights reserved