Winchart Technical Analysis -
Daily Market analysis

| Learn Technical Analysis and get your credit hours at the same time. WinChart Technical Analysis Training is Accredited by: | |||
 |
 |
||
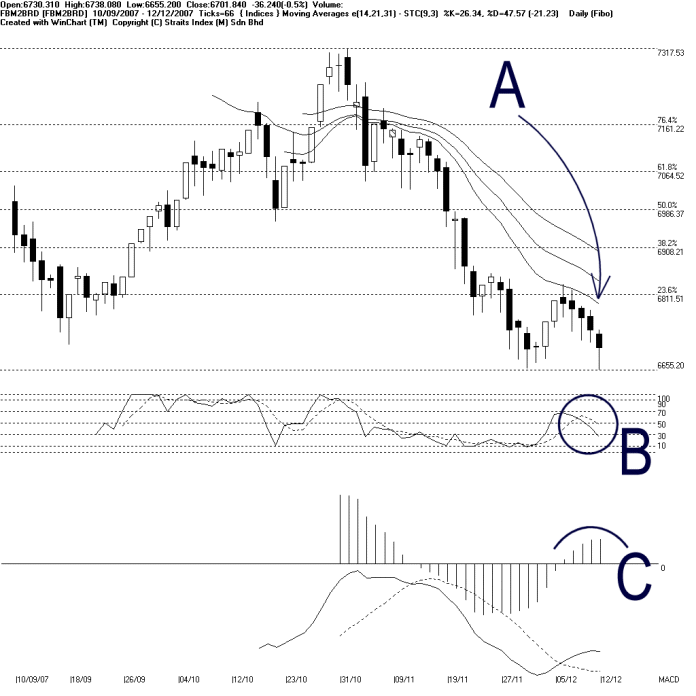
On Wednesday, the FBM2nd Board Index ended 36.24 points lower to close at 6701.84 points. As indicated by A, the 14, 21, 31 remains as the dynamic resistance for the FBM2nd Board Index, and therefore, if the FBM2nd Board Index should continue resisted by falling dynamic resistance, the outlook for the FBM2nd Board Index shall remains bearish biased. Mean while, support for the FBM2nd Board Index is still at 6658.04 level.
As circled at B, the Stochastic is still showing a short term neutral signal. However, readers are advised to take caution for the Stochastic %K line has dropped marginally below the 30% level. If the Stochastic %D line should break below the 30% level, it would confirm the %K line signal, and it would be a signal suggesting a short term bearish movement.
As indicated by C, the MACD histogram stop rising on Wednesday. Therefore, there is a risk of forming a rounding top. If the MACD histogram should form a rounding top, it would be a weakening of the MACD bullish signal, and the short term movement for the FBM2nd Board Index is like to turn weak.
Find this analysis useful? Why not share it with others? Click Here to send this to a friend
 1st Online Training In Malaysia |
 |
 |
 |
| View the Online Training | More Market Analysis | Find out more about WinChart | Upcoming Events |
Straits Index (M)
Sdn Bhd
No. 16, Jalan LP 1A / 5, Lestari Perdana,
43300 Seri Kembangan, Selangor
Hotline: (03) 8941 6828 (5 lines) Fax: (03) 8941
9828
Email: info@straitsindex.com
© Copyright 1997-2007 Straits Index (M) Sdn Bhd All
rights reserved