Winchart Technical Analysis -
Daily Market analysis

| Learn Technical Analysis and get your credit hours at the same time. WinChart Technical Analysis Training is Accredited by: | |||
 |
 |
||
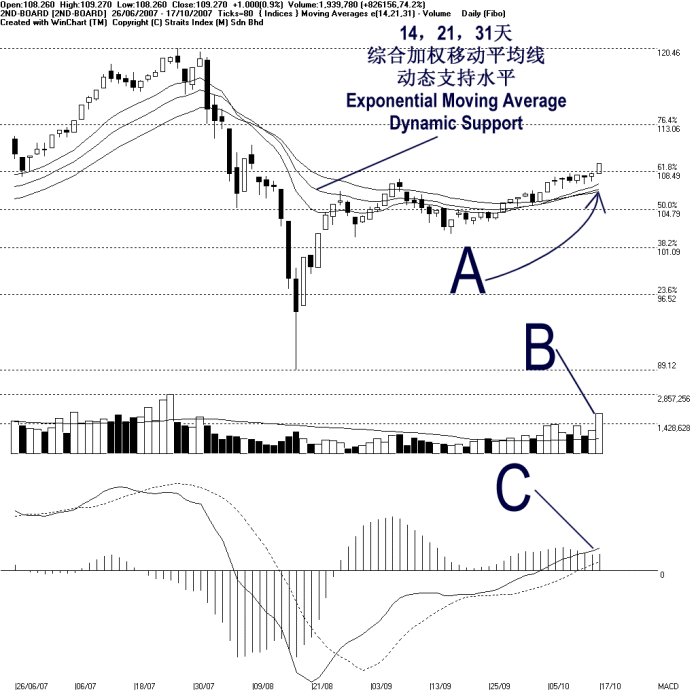
The 2nd board index breaks above the 108.49 Fibonacci Retracement resistance on Wednesday, closing 1 point higher to 109.27 points. Meanwhile, as indicated by A, the 14, 21, 31 EMA is still rising while supporting the 2nd board index as a dynamic support. Therefore, the 2nd board index is likely to break out from its consolidation and resume its uptrend.
As indicated by B, volume for the 2nd board market increased significantly while still staying above the 40-day VMA level. This shows an improvement interest of the 2nd board market and the increase of volume also suggests more new capital inflow into the 2nd board market. Therefore, provided that the volume should remains above the 40-day VMA level, the outlook for the 2nd board index shall remains positive.
As indicated by C, the MACD line remains rising, suggesting that the 2nd board is still trending up. If the MACD histogram should tick up and form a rounding bottom, it would suggests that the MACD bullish signal is regaining strength.
Find this analysis useful? Why not share it with others? Click Here to send this to a friend
 1st Online Training In Malaysia |
 |
 |
 |
| View the Online Training | More Market Analysis | Find out more about WinChart | Upcoming Events |
Straits Index (M)
Sdn Bhd
No. 16, Jalan LP 1A / 5, Lestari Perdana,
43300 Seri Kembangan, Selangor
Hotline: (03) 8941 6828 (5 lines) Fax: (03) 8941
9828
Email: info@straitsindex.com
© Copyright 1997-2007 Straits Index (M) Sdn Bhd All
rights reserved