Winchart Technical Analysis -
Daily Market analysis

| Learn Technical Analysis and get your credit hours at the same time. WinChart Technical Analysis Training is Accredited by: | |||
 |
 |
||
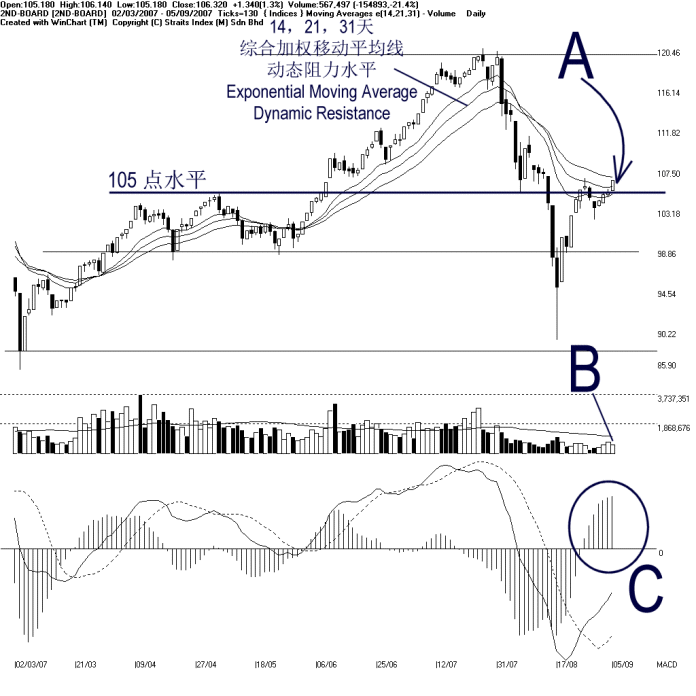
The 2nd board index advanced 1.34 points on Wednesday, closing at 106.32 points. As indicated by A, the 2nd board index managed to close above the 105 points resistance level, while still testing the 14, 21, 31 EMA dynamic resistance. If the 2nd board index should continue rising, the 14, 21, 31 EMA shall reverse its role as the dynamic support to the 2nd board index. (Study A)
Even though the 2nd board index increased 1.34 points, volume for the 2nd board market declined 21.4% on Wednesday. As indicated by B, the volume of the 2nd board market remains below the 40-day VMA level, suggesting that the market participation is still insufficient. (Study B)
As circled at C, the MACD histogram remains rising but still has a tendency in forming a rounding top. If the MACD histogram should form a rounding top, it would be a short term weakening of the MACD bullish signal. (Study C)
Find this analysis useful? Why not share it with others? Click Here to send this to a friend
 1st Online Training In Malaysia |
 |
 |
 |
| View the Online Training | More Market Analysis | Find out more about WinChart | Upcoming Events |
Straits Index (M)
Sdn Bhd
No. 16, Jalan LP 1A / 5, Lestari Perdana,
43300 Seri Kembangan, Selangor
Hotline: (03) 8941 6828 (5 lines) Fax: (03) 8941
9828
Email: info@straitsindex.com
© Copyright 1997-2007 Straits Index (M) Sdn Bhd All
rights reserved