Winchart Technical Analysis -
Daily Market analysis

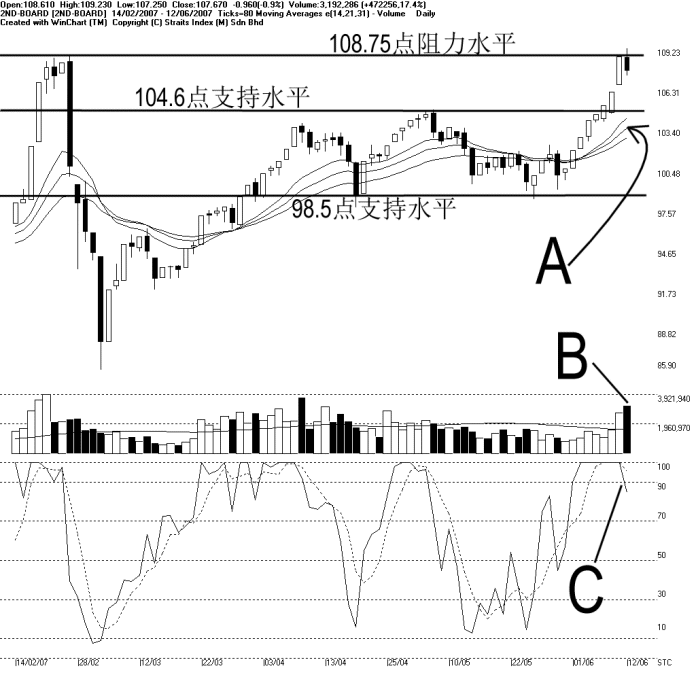
Despite an intra-day break out with a daily touching at the 109.23 points, the 2nd board closed below the 108.75 resistance. Therefore, the 108.75 points is still an important resistance for it outlines the memory of the investors which triggers some profit taking activities.
Meanwhile, the 14, 21, 31 EMA is still serving as the dynamic support to the 2nd board index. If the 2nd board index can be supported by the rising dynamic support, the uptrend is likely to resume. Nevertheless, other supports for the 2nd board index are found at 104.6 as well as the 98.5 level.
Although volume for the 2ndboard market increased another 17.4%, the increase of volume during a correction is also suggesting an increase of selling pressure. Therefore, this suggests that the 108.75 level is still an important resistance level. (Study B)
As indicated by C, the Stochastic %K line falls below the 90% level, giving the signal of a short term technical correction. However, if the Stochastic should stay above the 70% level after the technical correction, the market movement for the short term shall remains bullish biased.
Find this analysis useful? Why not share it with others? Click Here to send this to a friend
 1st Online Training In Malaysia |
 |
 |
 |
| View the Online Training | More Market Analysis | Find out more about WinChart | Upcoming Events |
Straits Index (M)
Sdn Bhd
No. 16, Jalan LP 1A / 5, Lestari Perdana,
43300 Seri Kembangan, Selangor
Hotline: (03) 8941 6828 (5 lines) Fax: (03) 8941
9828
Email: info@straitsindex.com
© Copyright 1997-2007 Straits Index (M) Sdn Bhd All
rights reserved