Winchart Technical Analysis -
Daily Market analysis

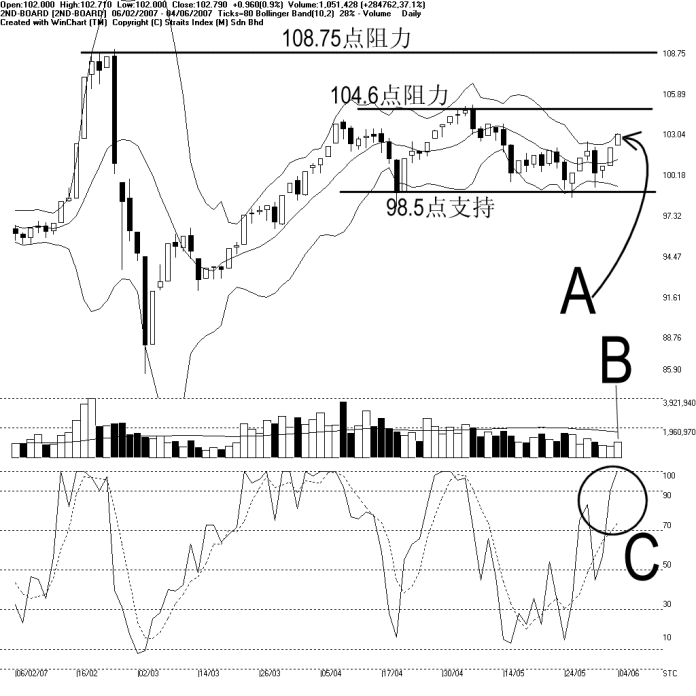
As indicated by A, the Bollinger Band width expanded 28% with the KLCI situated above the Bollinger middle band. This suggests an increase of the upside volatility of the 2nd board index, and provided that the Bollinger Band width could continue expand with the 2nd board index remains above the Bollinger middle band, the 2nd board is set to test the 104.6 resistance.
Despite the slight bullish signal from the Bollinger Bands, volume for the 2nd board remains below the 40-day VMA level. Therefore, the sustainability of this bullish signal is still questionable. Unless the volume can break above the 40-day VMA level, the bullish Bollinger Bands signal is likely to be a short one.
As circled at C, the Stochastic %K touches 100% level while the %D line breaks above the 70% level. This confirms the short term bullish signal. If the Stochastic should stay above the 70% level, the short term market movement for the 2nd board index is bullish biased.
Find this analysis useful? Why not share it with others? Click Here to send this to a friend
 1st Online Training In Malaysia |
 |
 |
 |
| View the Online Training | More Market Analysis | Find out more about WinChart | Upcoming Events |
Straits Index (M)
Sdn Bhd
No. 16, Jalan LP 1A / 5, Lestari Perdana,
43300 Seri Kembangan, Selangor
Hotline: (03) 8941 6828 (5 lines) Fax: (03) 8941
9828
Email: info@straitsindex.com
© Copyright 1997-2007 Straits Index (M) Sdn Bhd All
rights reserved