Winchart Technical Analysis -
Daily Market analysis

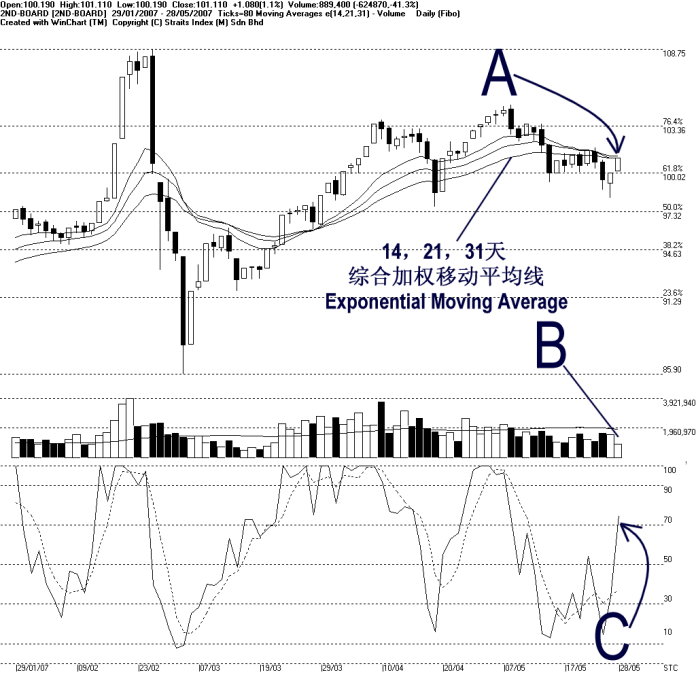
On Monday, the 2nd board index rose 1.08 points to 101.11 point. As indicated by A, the 2nd board index is testing the 14, 21, 31 EMA dynamic resistance again. If the 2nd board index can break above the falling dynamic resistance, it it likely to consolidate further.
Despite the 2nd board ended 1.08 points higher, volume for the 2nd board market fell 41.3%. As indicated by B, volume for the 2nd board market is still further below the 40-day VMA level. This suggests that the 2nd board market is indeed lack of participation, thus the 2nd board index is less likely to regain its strength.
As indicated by C, the Stochastic %K breaks above the 70% level on Monday, giving an unconfirmed short term bullish signal. If the %D line should break above the 70% level, it shall confirm the %K signal, and the market movement for the short term would be bullish biased. (Study C) Until that, Stochastic is currently showing a neutral signal.
Find this analysis useful? Why not share it with others? Click Here to send this to a friend
 1st Online Training In Malaysia |
 |
 |
 |
| View the Online Training | More Market Analysis | Find out more about WinChart | Upcoming Events |
Straits Index (M)
Sdn Bhd
No. 16, Jalan LP 1A / 5, Lestari Perdana,
43300 Seri Kembangan, Selangor
Hotline: (03) 8941 6828 (5 lines) Fax: (03) 8941
9828
Email: info@straitsindex.com
© Copyright 1997-2007 Straits Index (M) Sdn Bhd All
rights reserved