Winchart Technical Analysis -
Daily Market analysis

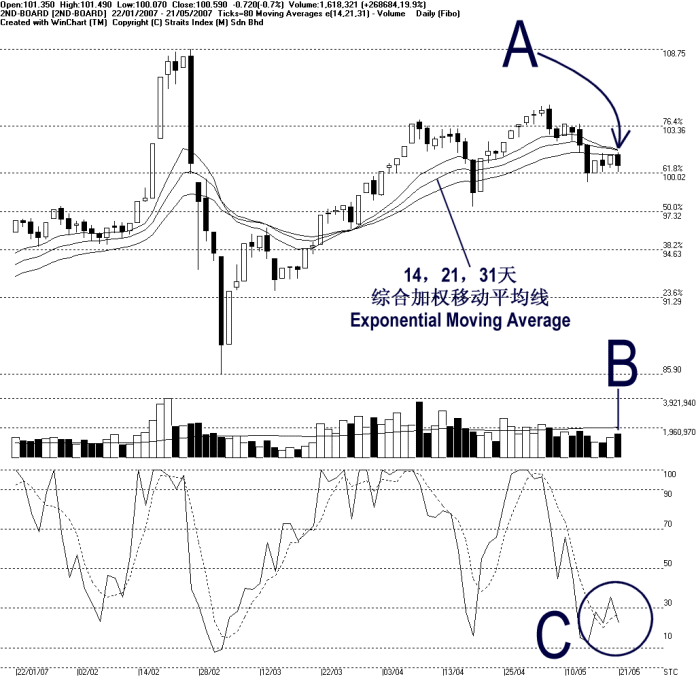
As indicated by A, the 2nd board index remained resisted at the 14, 21, 31 EMA. Meanwhile, it was also supported by the 100.02 Fibonacci Retracement line, and therefore, the 2nd board index is now consolidating in a narrow range.
If the 2nd board should fall below the 100.02 support, the next support would be at 97.32 WinChart Automatic Fibonacci Retracement, and the 14, 21, 31 EMA shall continue serving as the dynamic resistance.
Although volume for the 2nd board market increased 19.9%, it still remains below the 40-day VMA level, suggesting that the participation of the 2nd board market is still relatively insufficient. In addition, if the volume should continue increase while the 2nd board index remains falling, it would suggest an increase of selling pressure. (Study B)
As circled at C, the Stochastic %K failed to stay above the 30% level, re-entering into the short term bearish region on Monday. Therefore, the Stochastic is still showing a short term bearish signal, and the market movement for the short term shall remain bearish biased. (Study the C Circle)
Find this analysis useful? Why not share it with others? Click Here to send this to a friend
 1st Online Training In Malaysia |
 |
 |
 |
| View the Online Training | More Market Analysis | Find out more about WinChart | Upcoming Events |
Straits Index (M)
Sdn Bhd
No. 16, Jalan LP 1A / 5, Lestari Perdana,
43300 Seri Kembangan, Selangor
Hotline: (03) 8941 6828 (5 lines) Fax: (03) 8941
9828
Email: info@straitsindex.com
© Copyright 1997-2007 Straits Index (M) Sdn Bhd All
rights reserved