Winchart Technical Analysis -
Daily Market analysis

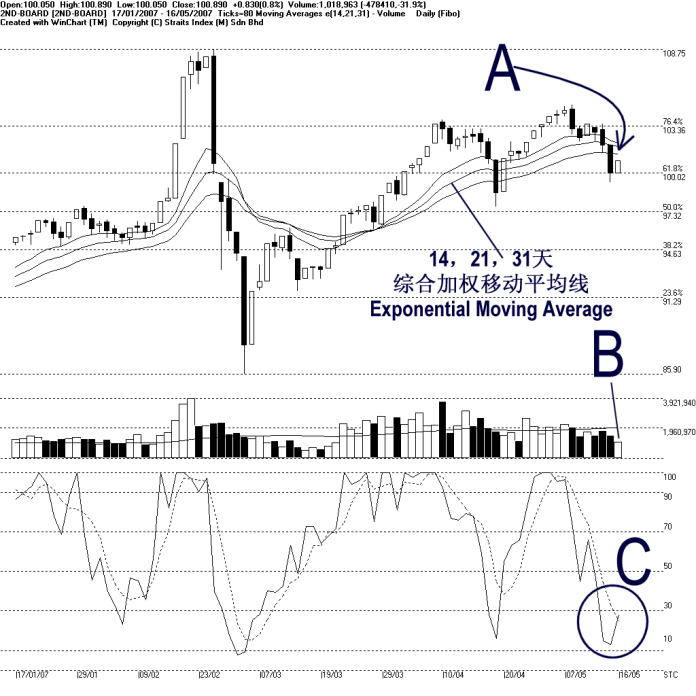
On Wednesday, the 2nd board index rebounded from the 100.02 Fibonacci Retracement, and temporary stopped the decline. However, as indicated by A, the 2nd board index is now situated below the 14, 21, 31 EMA. If the 2nd board index should continue to stay below the 14, 21, 31 EMA, the EMA shall convert its role to the dynamic resistance, and the risk for the 2nd board index to further decline would be higher. (Study A)
Volume for the 2nd board market decreased another 16.3%, while continued staying below the 40-day VMA level. This undoubtedly suggesting that the 2nd board market is lack of inflow of fresh capital, thus the 2nd board index is likely to stay weak. (Study B)
As the 2nd board index rebound, the Stochastic %K also rebounded on Wednesday. However, it is still situated below the 30% level, thus the short term bearish region. Meanwhile, the %D line also fell below the 30% level, confirming the short term bearish signal. If the Stochastic should remain below the 30% level, the market movement for the short term would be bearish biased. (Study C)
Find this analysis useful? Why not share it with others? Click Here to send this to a friend
 1st Online Training In Malaysia |
 |
 |
 |
| View the Online Training | More Market Analysis | Find out more about WinChart | Upcoming Events |
Straits Index (M)
Sdn Bhd
No. 16, Jalan LP 1A / 5, Lestari Perdana,
43300 Seri Kembangan, Selangor
Hotline: (03) 8941 6828 (5 lines) Fax: (03) 8941
9828
Email: info@straitsindex.com
© Copyright 1997-2007 Straits Index (M) Sdn Bhd All
rights reserved