Winchart Technical Analysis -
Daily Market analysis

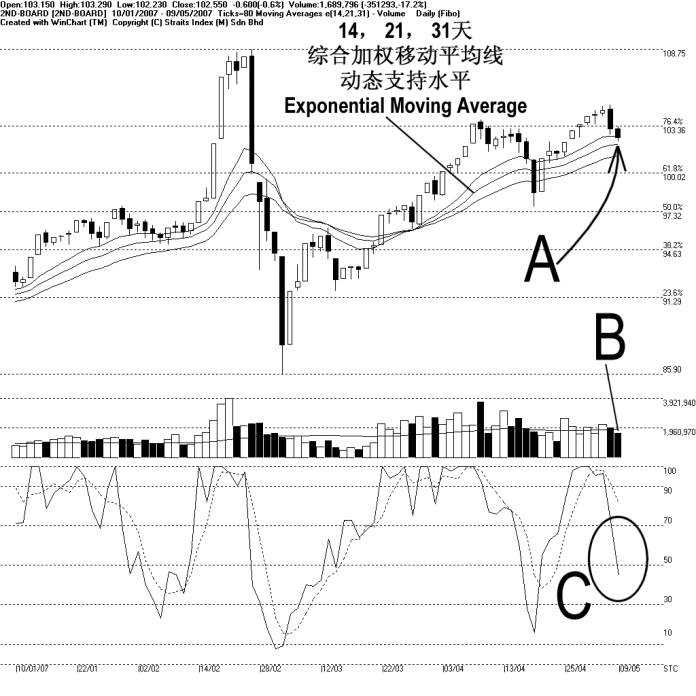
The 2nd board index continued its technical correction on Wednesday, ended 0.6 of a point to 102.55 points. As indicated by A, the 14, 21, 31 EMA is still serving as the dynamic support to the 2nd board index. Therefore, if the 2nd board index can rebound from the dynamic support, the uptrend would still be intact.
Volume for the 2nd board market declined 17.2% on Wednesday. Also, the volume was situated below the 40-day VMA level, suggesting that most investors are still on the sidelines as the 2nd board is correcting. Therefore, with volume staying below the 40-day VMA level, the 2nd board index is likely to continue its consolidation.
As circled at C, the Stochastic %K line fell below the 70% level, ended the short term bullish signal. However, the %D line is still staying above the 70% level. Therefore, if the %K line should rebound and re-enter the bullish region, the short term bullish movement shall resume. (Study C)
Find this analysis useful? Why not share it with others? Click Here to send this to a friend
 1st Online Training In Malaysia |
 |
 |
 |
| View the Online Training | More Market Analysis | Find out more about WinChart | Upcoming Events |
Straits Index (M)
Sdn Bhd
No. 16, Jalan LP 1A / 5, Lestari Perdana,
43300 Seri Kembangan, Selangor
Hotline: (03) 8941 6828 (5 lines) Fax: (03) 8941
9828
Email: info@straitsindex.com
© Copyright 1997-2007 Straits Index (M) Sdn Bhd All
rights reserved