Winchart Technical Analysis -
Daily Market analysis

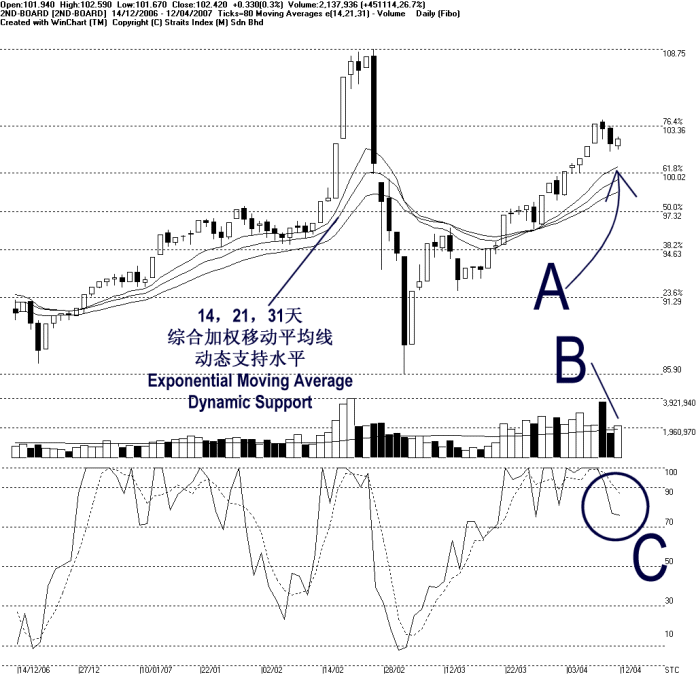
On Thursday, the 2nd board index continued its technical correction, ended 0.33 of a point with last minute gain, to close at 102.42 points. Currently, 103.36 Fibonacci Retracement remained as the immediate resistance while the 14, 21, 31 EMA is still serving as the dynamic support. If the 2nd board index was to resume its uptrend, it must rebound from this rising dynamic support. (Study A)
Volume for the 2nd board market gained 26.7%, while returned to above the 40 days VMA level. If the 2nd board index was to retest the 103.36 Fibonacci Retracement resistance level and resume its uptrend, volume staying above the 40 days VMA level is the crucial element. (Study B)
As pointed by C, Stochastic %D line fell below 90% level on Thursday, confirming the %K signal. At the moment, Stochastic remained in the short-term bullish region (70%-100%), and therefore, the short-term movement for the 2nd board index is likely to stay bullish bias. (Study C)
Find this analysis useful? Why not share it with others? Click Here to send this to a friend
 1st Online Training In Malaysia |
 |
 |
 |
| View the Online Training | More Market Analysis | Find out more about WinChart | Upcoming Events |
Straits Index (M)
Sdn Bhd
No. 16, Jalan LP 1A / 5, Lestari Perdana,
43300 Seri Kembangan, Selangor
Hotline: (03) 8941 6828 (5 lines) Fax: (03) 8941
9828
Email: info@straitsindex.com
© Copyright 1997-2007 Straits Index (M) Sdn Bhd All
rights reserved