Winchart Technical Analysis -
Daily Market analysis

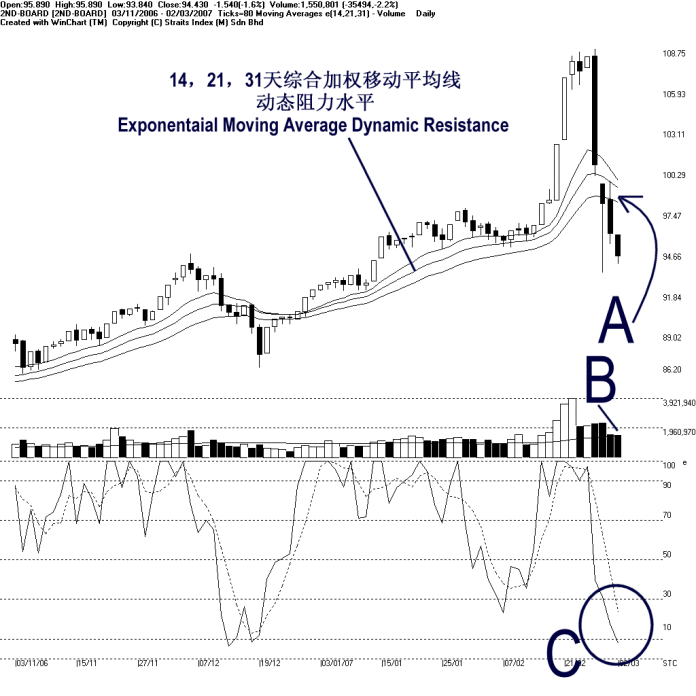
The 2nd board index ended lower on Friday, closing 1.54 points lower to 94.43 points. As pointed by A, the 14, 21, 31 EMA started falling, and now it is becoming the dynamic resistance to the 2nd board index. If the 2nd board index stayed below this dynamic resistance, the outlook is likely to be bearish bias. (Study A) The next support level for the 2nd board index is now at 91.84 Fibonacci retracement.
Market volume for the 2nd board remained almost unchanged, but still managed to touch above the 40 day VMA level. However, relatively the market volume has declined, and if the market volume remained low, chances for the 2nd board to resume its position above the 14, 21, 31 EMA is likely to stay low. (Study B)
Stochastic %D fell below 30% level, confirming the %K signal. Therefore, Stochastic is now showing a short-term bearish signal, and the market movement for the short-term is likely to be bearish bias. (Study C)
Find this analysis useful? Why not share it with others? Click Here to send this to a friend
 1st Online Training In Malaysia |
 |
 |
 |
| View the Online Training | More Market Analysis | Find out more about WinChart | Upcoming Events |
Straits Index (M)
Sdn Bhd
No. 16, Jalan LP 1A / 5, Lestari Perdana,
43300 Seri Kembangan, Selangor
Hotline: (03) 8941 6828 (5 lines) Fax: (03) 8941
9828
Email: info@straitsindex.com
© Copyright 1997-2007 Straits Index (M) Sdn Bhd All
rights reserved