
2012-06-28e
| We
are an approved Securities Industry Development Corporation (SIDC)-CPE Training Provider. the training and development arm of the Securities Commission Malaysia (SC). |
|
|


 |
|
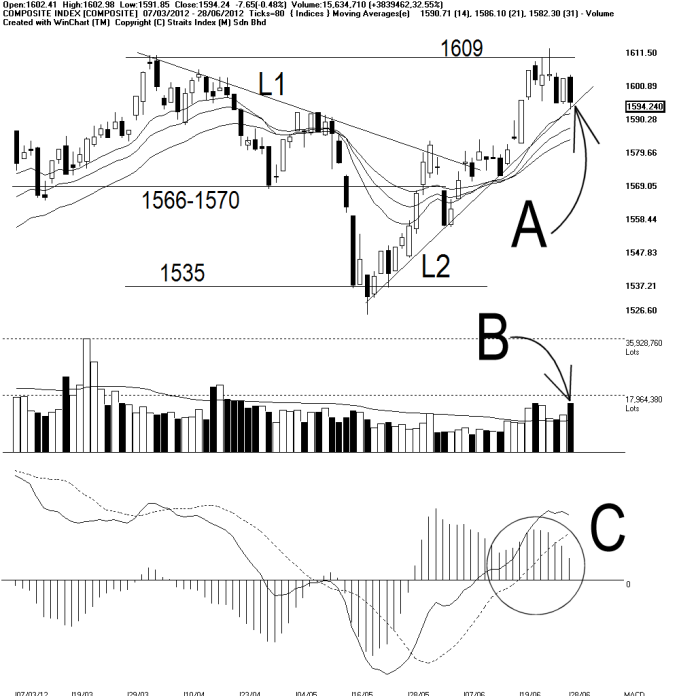
As indicated by A, the FBM KLCI retreated and precisely testing the L2 uptrend line and the 14, 21, 31 EMA dynamic support. The KLCI fell 7.65 points or 0.48% to close at 1594.24 points. Resistance for the KLCI remains at 1609-1611. As indicated by B, total market volume increased 32.55%. Part of the reason was the active trading of Felda Global Venture Holding Bhd, which has accounted a little more than 16% of the total market volume. Nevertheless, with losers outnumbered gainers (477 to 248), the increased of volume actually suggests some increased of selling pressure. As circled at C, the MACD histogram is still falling, thus no Rounding Bottom signal is sighted yet. The falling of the MACD histogram suggests that the KLCI is still losing strength or it is still consolidating. In conclusion, the FBM KLCI is testing its L2 uptrend line. If the KLCI should break below this L2 line, it means that the L2 uptrend would be temporary interrupted. However, a break below the L2 does not necessary means an immediate bearish reversal, at least not until the KLCI has formed lower-highs. On the other hand, if the KLCI could rebound from the L2 line or the 14, 21, 31 EMA, and forms Higher-Lows, it means that the current uptrend is still intact. |
Straits Index (M)
Sdn Bhd
No. 16, Jalan LP 1A / 5, Lestari Perdana,
43300 Seri Kembangan, Selangor
Hotline: (03) 8941 6828 (5
lines) Fax: (03) 8941 9828
Email: info@straitsindex.com
© Copyright 1997-2012 Straits Index (M) Sdn Bhd All
rights reserved