WinChart Technical Analysis
Daily Market Analysis
| We
are an approved Securities Industry Development Corporation (SIDC)-CPE Training Provider. the training and development arm of the Securities Commission Malaysia (SC). |
|||
 |
 |
||
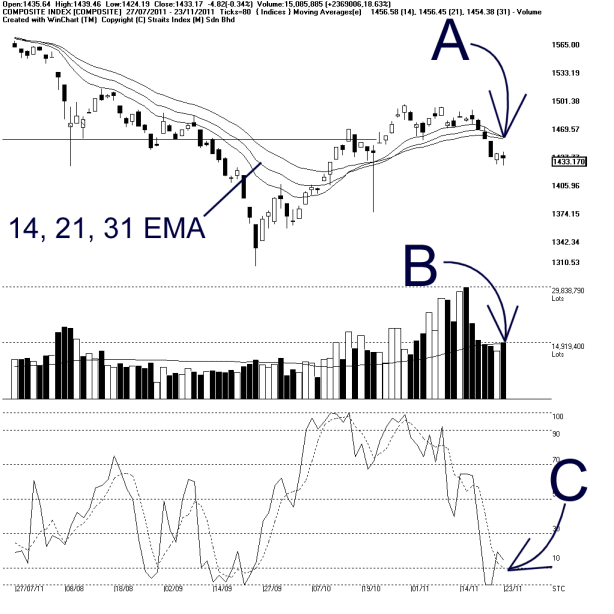
On Wednesday, the KLCI had its intraday low reaching 1424.19 points, but started to regain some of its earlier losses in the after noon session, which helped reducing the losses of the KLCI from 13.68 points to only 4.82 points or 0.34%, closing at 1433.17 points. As indicated by A, the 14, 21, 31 EMA is still serving as the dynamic resistance to the KLCI while the support is at 1420 Fibonacci.
As indicated by B, total market volume increased 18.63%, with volume barely above the 40-day volume moving average. Generally, if volume should stay above the 40-day volume moving average, it suggests that the market is actively participated, or at least able to hold up to a healthy level. Generally, higher volume is likely to help improving the market sentiment. However, the most ideal situation is that volume is increasing together with the price (or index), if volume should increase with price (or index) falling, it may imply some increased of selling pressure.
As indicated by C, the Stochastic stays below 30%, in the short term bearish territory. This suggests that the KLCI short term movement is still weak.
In conclusion, after breaking below the 14, 21, 31 EMA, the immediate technical outlook for the KLCI is now on the negative side, and the previous short term uptrend has been violated too. However, the KLCI has not formed a downtrend, for there is no formation of Lower-highs yet.
Find this analysis useful? Why not share it with others? Click Here to send this to a friend
 1st Online Training In Malaysia |
 |
 |
 |
| View the Online Training | More Market Analysis | Find out more about WinChart | Upcoming Events |
Straits Index (M)
Sdn Bhd
No. 16, Jalan LP 1A / 5, Lestari Perdana,
43300 Seri Kembangan, Selangor
Hotline: (03) 8941 6828 (5
lines) Fax: (03) 8941 9828
Email: info@straitsindex.com
© Copyright 1997-2010 Straits Index (M) Sdn Bhd All
rights reserved