WinChart Technical Analysis
Daily Market Analysis
| We
are an approved Securities Industry Development Corporation (SIDC)-CPE Training Provider. the training and development arm of the Securities Commission Malaysia (SC). |
|||
 |
 |
||
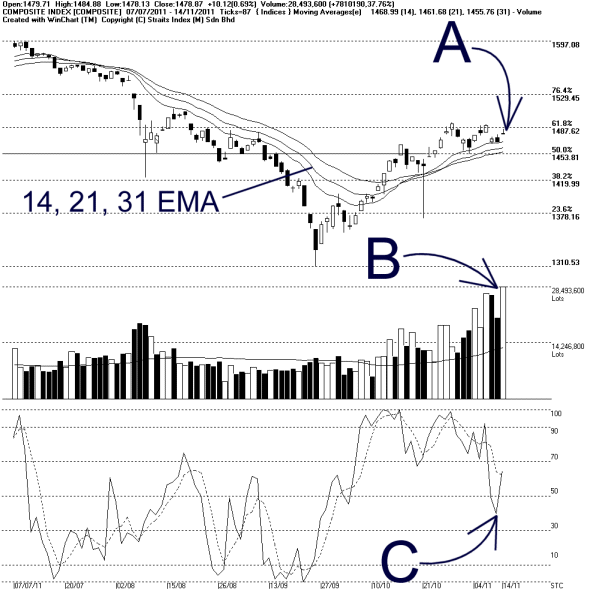
As indicated by A, the KLCI managed to find its support at the 14, 21, 31 EMA on Monday, rebounded 10.12 points or 0.69% to close at 1478.87 points. This suggests that the short term uptrend of the KLCI is still intact, but the KLCI is yet to break above its 1487 Fibonacci Retracement Line.
As indicated by B, total market volume increased 37.76%, with volume highly above the 40-day volume moving average. This suggests that the overall market is actively participated. However, due to the high volume trading at low-priced stocks, the high volume on Monday failed to reflect the true sentiment of the entire market.
As indicated by C, the Stochastic rebounded on Monday, thus not showing any short term bearish signal for the KLCI. If the Stochastic should continue to rebound, and later break above 70%, it would be a short term bullish biased signal for the KLCI.
In conclusion, the short term uptrend of the KLCI is still intact, and the immediate technical outlook for the KLCI is still positive. The high market volume are mostly contributed from low-priced stocks heavy trading volume, thus this is not the true picture of the improvement of the market sentiment.
Find this analysis useful? Why not share it with others? Click Here to send this to a friend
 1st Online Training In Malaysia |
 |
 |
 |
| View the Online Training | More Market Analysis | Find out more about WinChart | Upcoming Events |
Straits Index (M)
Sdn Bhd
No. 16, Jalan LP 1A / 5, Lestari Perdana,
43300 Seri Kembangan, Selangor
Hotline: (03) 8941 6828 (5
lines) Fax: (03) 8941 9828
Email: info@straitsindex.com
© Copyright 1997-2010 Straits Index (M) Sdn Bhd All
rights reserved