WinChart Technical Analysis
Daily Market Analysis
| We
are an approved Securities Industry Development Corporation (SIDC)-CPE Training Provider. the training and development arm of the Securities Commission Malaysia (SC). |
|||
 |
 |
||
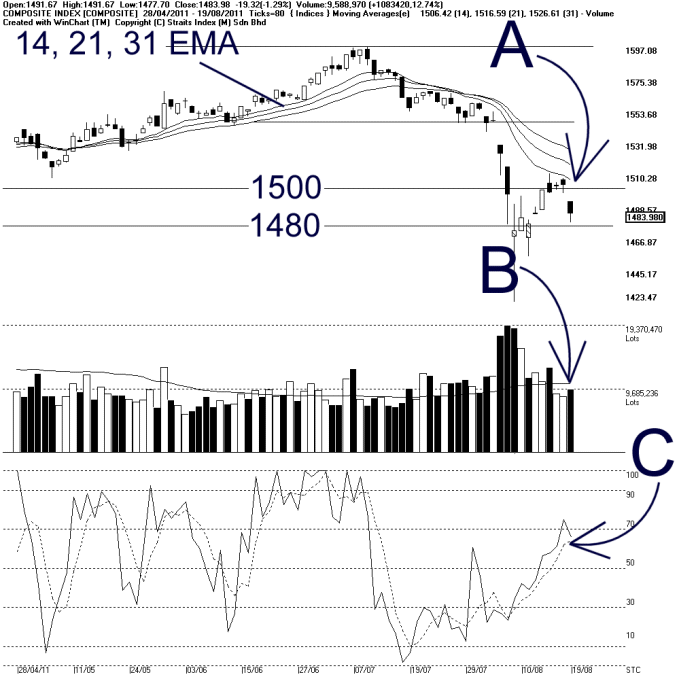
As indicated by A, the KLCI ended lower on Friday, after being resisted by the 14, 21, 31 EMA dynamic resistance on Thursday, amid the over night huge loss in the US markets. The KLCI fell 19.32 points or 1.29%, to close at 1483.98 points. Support for the KLCI is at 1480 while the resistance is at 1500 other than the 14, 21, 31 EMA dynamic resistance.
As indicated by B, total market volume increased 12.74%, but below the 40-day volume moving average. This shows that the market is still quiet, as investors are still not feeling confident about the local market.
As indicated by C, the Stochastic failed to stay above 70%, thus canceling yesterday's short term bullish signal. On the other hand, if the Stochastic should fall below 30%, it would be a short term bearish signal for the KLCI.
In conclusion, with the KLCI resisted by the 14, 21, 31 EMA, the KLCI formed a Lower-High on Friday, and the technical outlook for the KLCI remains weak.
Find this analysis useful? Why not share it with others? Click Here to send this to a friend
 1st Online Training In Malaysia |
 |
 |
 |
| View the Online Training | More Market Analysis | Find out more about WinChart | Upcoming Events |
Straits Index (M)
Sdn Bhd
No. 16, Jalan LP 1A / 5, Lestari Perdana,
43300 Seri Kembangan, Selangor
Hotline: (03) 8941 6828 (5
lines) Fax: (03) 8941 9828
Email: info@straitsindex.com
© Copyright 1997-2010 Straits Index (M) Sdn Bhd All
rights reserved