WinChart Technical Analysis
Daily Market Analysis
| We
are an approved Securities Industry Development Corporation (SIDC)-CPE Training Provider. the training and development arm of the Securities Commission Malaysia (SC). |
|||
 |
 |
||
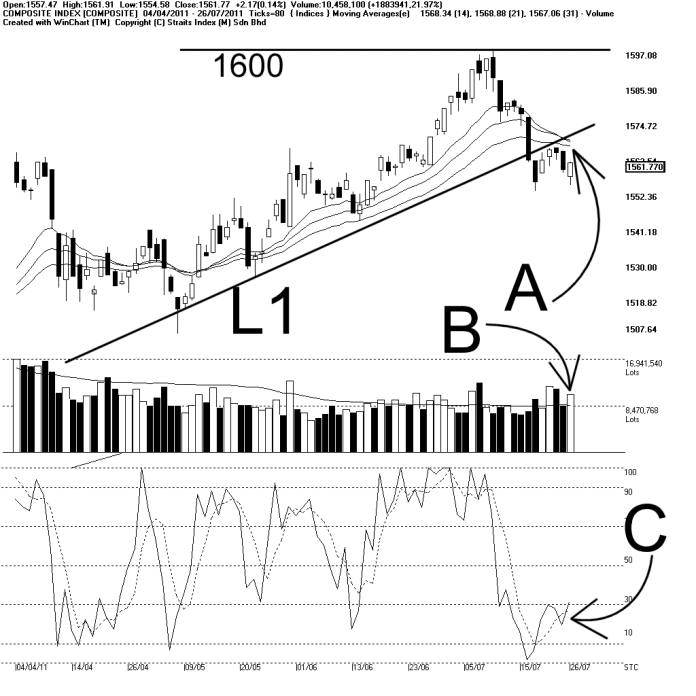
As indicated by A, the KLCI rebounded 2.17 points or 0.14% on Tuesday, but still resisted by the Exponential Moving Average (EMA). Support for the KLCI is at 1552 WinChart automatic Fibonacci retracement.
As indicated by B, total market volume increased 21.97%, with volume breaking above the 40-day volume moving average. Technically, if volume should stay above the 40-day volume moving average, it is likely to help lifting the market sentiment as a whole.
As indicated by C, the Stochastic breaks above 30% by margin, and since the break out is not significant, it is too closed to call for any signal. Nevertheless, if the Stochastic should break above 30%, it is a signal suggesting a short term technical rebound.
In conclusion, despite the rebound, the KLCI failed to return to above the L1 line, and the short term movement is likely to stay weak. However, the KLCI has not formed a downtrend yet, not until the KLCI should form a Lower-High, or breaking below an important support. The important support for the KLCI is at 1500 level.
Find this analysis useful? Why not share it with others? Click Here to send this to a friend
 1st Online Training In Malaysia |
 |
 |
 |
| View the Online Training | More Market Analysis | Find out more about WinChart | Upcoming Events |
Straits Index (M)
Sdn Bhd
No. 16, Jalan LP 1A / 5, Lestari Perdana,
43300 Seri Kembangan, Selangor
Hotline: (03) 8941 6828 (5
lines) Fax: (03) 8941 9828
Email: info@straitsindex.com
© Copyright 1997-2010 Straits Index (M) Sdn Bhd All
rights reserved