WinChart Technical Analysis
Daily Market Analysis
| We
are an approved Securities Industry Development Corporation (SIDC)-CPE Training Provider. the training and development arm of the Securities Commission Malaysia (SC). |
|||
 |
 |
||
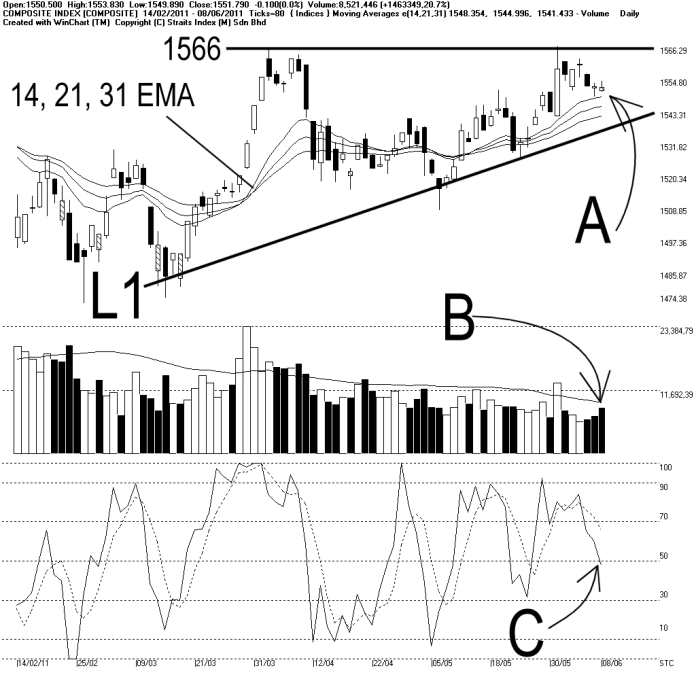
As indicated by A, the KLCI was trading at a narrow range on Wednesday, losing only 0.1 of a point. The 1566 is still the resistance for the KLCI, while the 14, 21, 31 EMA dynamic support as well as the L1 ascending line are the support for the KLCI.
As indicated by B, total market volume increased 20.7%, and this brings the volume closer to the 40-day Volume Moving Average. However, it is still below the 40-day Volume Moving Average, thus suggesting that the market participation is not yet at an ideal level. If volume could increase and stay above the 40-day Volume Moving Average, the market sentiment is general is likely to improve.
As indicated by C, the Stochastic has not returned to above 70%, and now testing 50%. Technically, when the Stochastic is staying around 50%, it suggests that the short term movement of the KLCI is likely to stay in a sideways manner.
In conclusion, although the KLCI has not broken above the 1566 resistance, the current technical outlook for the KLCI remains positive, with the KLCI still above the 14, 21, 31 EMA as well as the L1 line.
Find this analysis useful? Why not share it with others? Click Here to send this to a friend
 1st Online Training In Malaysia |
 |
 |
 |
| View the Online Training | More Market Analysis | Find out more about WinChart | Upcoming Events |
Straits Index (M)
Sdn Bhd
No. 16, Jalan LP 1A / 5, Lestari Perdana,
43300 Seri Kembangan, Selangor
Hotline: (03) 8941 6828 (5
lines) Fax: (03) 8941 9828
Email: info@straitsindex.com
© Copyright 1997-2010 Straits Index (M) Sdn Bhd All
rights reserved