WinChart Technical Analysis
Daily Market Analysis
| We
are an approved Securities Industry Development Corporation (SIDC)-CPE Training Provider. the training and development arm of the Securities Commission Malaysia (SC). |
|||
 |
 |
||
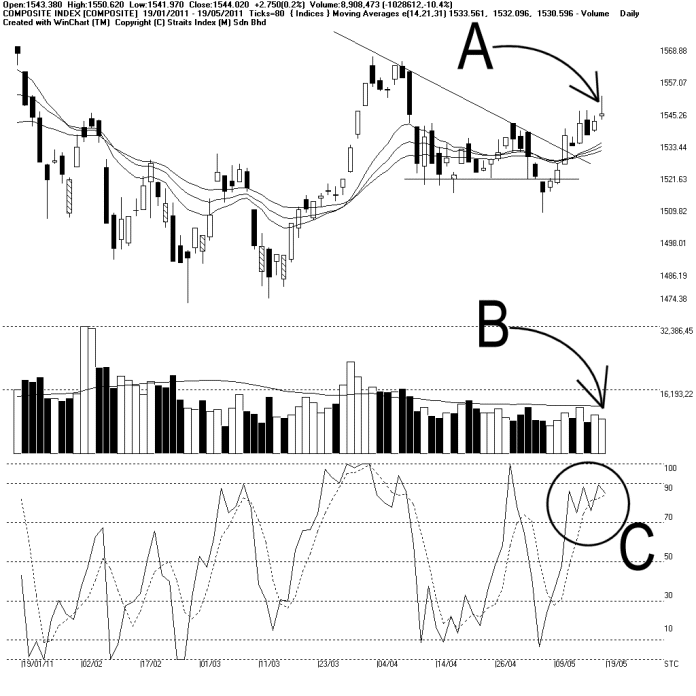
As indicated by A, the KLCI had its intra-day high reaching 1550.62 on Thursday, but due to profit taking, the KLCI failed to sustain its early gains, but ended only with 2.75 points or 0.2% higher. Still, the KLCI is above the 14, 21, 31 EMA.
Meanwhile, the Bollinger Bands expanded 12% with the KLCI above the Bollinger Middle Band, this suggests that the current volatility is bullish biased. Support for the KLCI is at 1532.78 WinChart Automatic Fibonacci Retracement while the resistance is at 1546.58 WinChart Automatic Fibonacci Retracement followed by the recent high of 1566.
As indicated by B, total market volume fell 10.4%, while still below the 40-day Volume Moving Average. This suggests that the market participation is still low, as investors are still not feeling confident about the local market.
As circled at C, the Stochastic stays above 70%, in the short term bullish territory. This suggests that the short term movement of the KLCI is bullish biased.
In short, the immediate technical outlook for the KLCI is positive, while the short term movement is bullish biased. However, the KLCI is still not forming an uptrend, not until the KLCI could form a higher-low or break above it recent high. Most importantly, the market is lack of inflow of fresh capital.
Find this analysis useful? Why not share it with others? Click Here to send this to a friend
 1st Online Training In Malaysia |
 |
 |
 |
| View the Online Training | More Market Analysis | Find out more about WinChart | Upcoming Events |
Straits Index (M)
Sdn Bhd
No. 16, Jalan LP 1A / 5, Lestari Perdana,
43300 Seri Kembangan, Selangor
Hotline: (03) 8941 6828 (5
lines) Fax: (03) 8941 9828
Email: info@straitsindex.com
© Copyright 1997-2010 Straits Index (M) Sdn Bhd All
rights reserved