WinChart Technical Analysis
Daily Market Analysis
| We
are an approved Securities Industry Development Corporation (SIDC)-CPE Training Provider. the training and development arm of the Securities Commission Malaysia (SC). |
|||
 |
 |
||
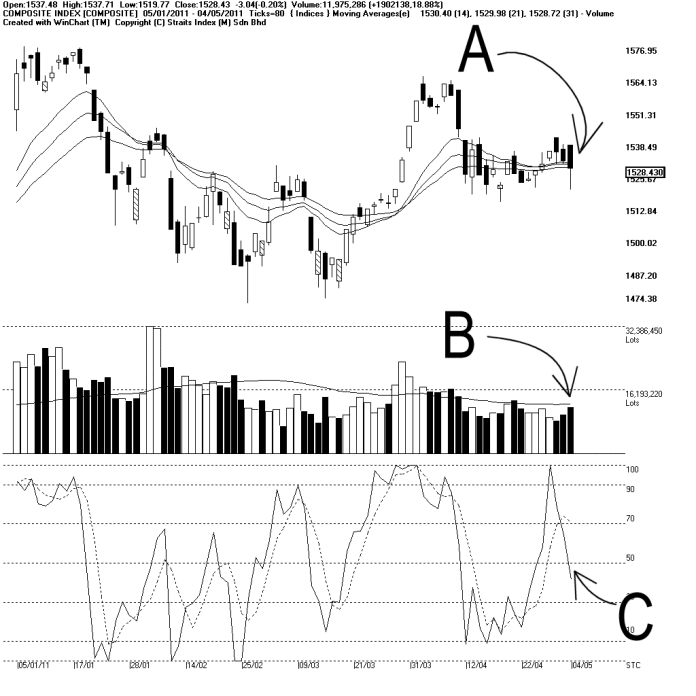
As indicated by A, the FBM KLCI had its intra-day breaking below the 14, 21, 31 EMA, with its daily low touching 1519.77 points, it managed to regain some of its early losses after mid-day, and at the close, the KLCI fell 3.04 points or 0.2% at 1528.43 points.
Although the KLCI managed to close at the 31-day EMA level, it does not suggests any positive signal. Since the KLCI has been moving sideways, and as a result, the 14, 21, 31 EMA are also moving in a sideways manner, and this has reduced the significance and reliability of the function of the EMA. Meanwhile, the Bollinger Bands has not expanded clearly, and this shows that the KLCI is basically still consolidating. Support for the KLCI is at 1513.56 while the resistance stays at 1538 WinChart Automatic Fibonacci Retracement.
As indicated by B, total market volume increased 18.88%, with volume getting closer to the 40-day Volume Moving Average. However, due to the intra-day sharp fall of the KLCI, the increased of volume could actually suggests some increased of selling pressure instead.
As indicated by C, the Stochastic is still falling, but it has not broken below 30%, thus not yet showing any short term bearish signal. If the Stochastic should stay around 50%, the short term movement of the KLCI is likely to be in a sideways manner.
In conclusion, with losers outnumbered gainers by large, the increased of volume implies that the selling pressure was slightly stronger on Wednesday. If the KLCI should form a lower-High, it would be an early sign implying a weakening movement for the KLCI, until then, the KLCI remains in its consolidation.
Find this analysis useful? Why not share it with others? Click Here to send this to a friend
 1st Online Training In Malaysia |
 |
 |
 |
| View the Online Training | More Market Analysis | Find out more about WinChart | Upcoming Events |
Straits Index (M)
Sdn Bhd
No. 16, Jalan LP 1A / 5, Lestari Perdana,
43300 Seri Kembangan, Selangor
Hotline: (03) 8941 6828 (5
lines) Fax: (03) 8941 9828
Email: info@straitsindex.com
© Copyright 1997-2010 Straits Index (M) Sdn Bhd All
rights reserved