WinChart Technical Analysis
Daily Market Analysis
| We
are an approved Securities Industry Development Corporation (SIDC)-CPE Training Provider. the training and development arm of the Securities Commission Malaysia (SC). |
|||
 |
 |
||
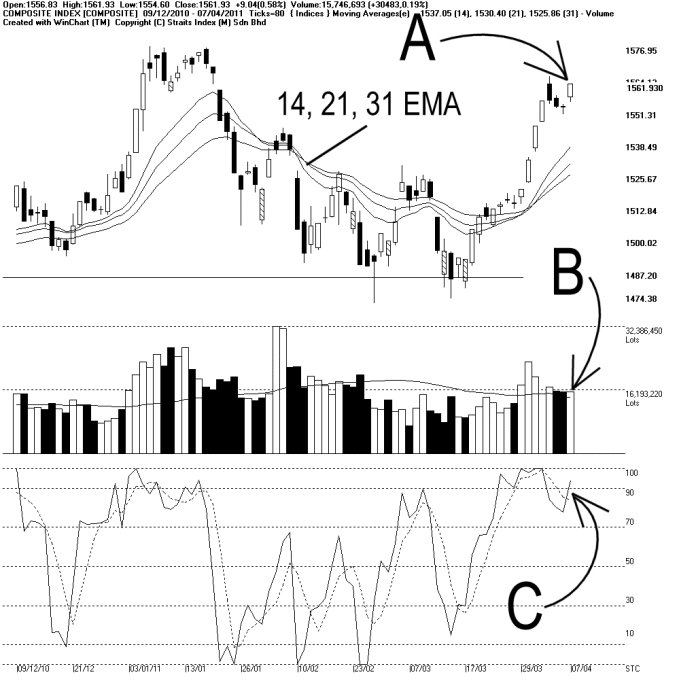
Meanwhile, the Bollinger Bands expanded 2%, with the KLCI above the Bollinger Middle Band. The technical outlook for the KLCI is on the positive side. If the Bollinger Bands should continue to expand, while the KLCI stays above the Bollinger Middle Band, more upside volatility for the KLCI is expected.
As indicated by B, total market volume increased 0.19%, with volume above the 40-day Volume Moving Average. This suggests that the market is still actively participated. However, if the KLCI were to break above the 1577 resistance, more volume is needed.
As indicated by C, the Stochastic remains above 70%, in the short term bullish territory. This suggests that the short term movement of the KLCI is still strong.
In conclusion, since the KLCI is still staying above the rising 14, 21, 31 EMA, and if the KLCI should continue rising, it means that the consolidation is over, and the KLCI will be testing the 1577 resistance.
Find this analysis useful? Why not share it with others? Click Here to send this to a friend
 1st Online Training In Malaysia |
 |
 |
 |
| View the Online Training | More Market Analysis | Find out more about WinChart | Upcoming Events |
Straits Index (M)
Sdn Bhd
No. 16, Jalan LP 1A / 5, Lestari Perdana,
43300 Seri Kembangan, Selangor
Hotline: (03) 8941 6828 (5
lines) Fax: (03) 8941 9828
Email: info@straitsindex.com
© Copyright 1997-2010 Straits Index (M) Sdn Bhd All
rights reserved