WinChart Technical Analysis
Daily Market Analysis
| We
are an approved Securities Industry Development Corporation (SIDC)-CPE Training Provider. the training and development arm of the Securities Commission Malaysia (SC). |
|||
 |
 |
||
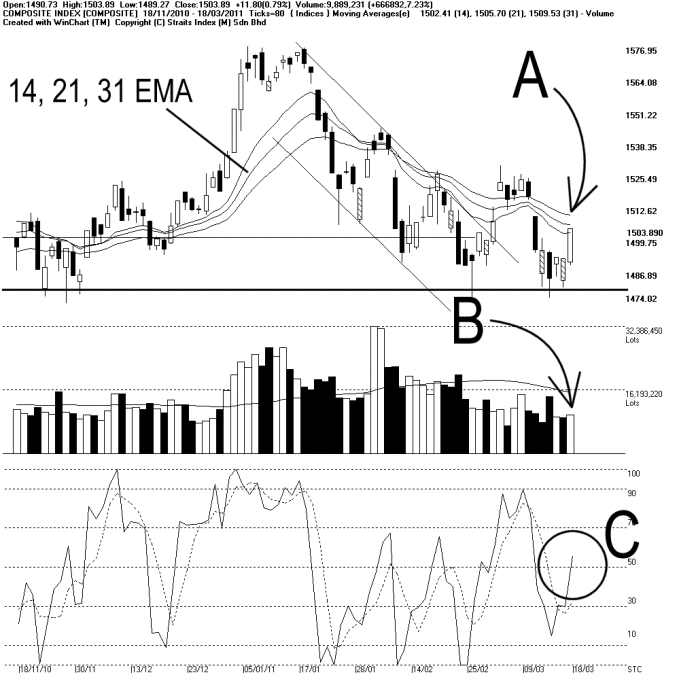
Meanwhile, the Bollinger Bands expanded only 1%, and this suggests that the KLCI movement is still unclear. Nevertheless, the KLCI is also testing the Bollinger Middle Band right now.
As indicated by B, total market volume increased 7.23%, but still far below the 40-day Volume Moving Average. Market is undoubtedly quiet, and the low inflow of fresh capital is unlikely to lift the KLCI or the market sentiment as a whole.
As circled at C, the Stochastic breaks above 50%, and this suggests that the KLCI has broken away from the short term bearish territory. If the Stochastic should break above 70%, it would be a short term bullish signal for the KLCI.
In short, the support of 1480 helps the KLCI is prolong its consolidation, thus reducing the risk of forming a downtrend right now. However, with the KLCI still below the 14, 21, 31 EMA, the technical outlook is still weak.
Find this analysis useful? Why not share it with others? Click Here to send this to a friend
 1st Online Training In Malaysia |
 |
 |
 |
| View the Online Training | More Market Analysis | Find out more about WinChart | Upcoming Events |
Straits Index (M)
Sdn Bhd
No. 16, Jalan LP 1A / 5, Lestari Perdana,
43300 Seri Kembangan, Selangor
Hotline: (03) 8941 6828 (5
lines) Fax: (03) 8941 9828
Email: info@straitsindex.com
© Copyright 1997-2010 Straits Index (M) Sdn Bhd All
rights reserved