WinChart Technical Analysis
Daily Market Analysis
| We
are an approved Securities Industry Development Corporation (SIDC)-CPE Training Provider. the training and development arm of the Securities Commission Malaysia (SC). |
|||
 |
 |
||
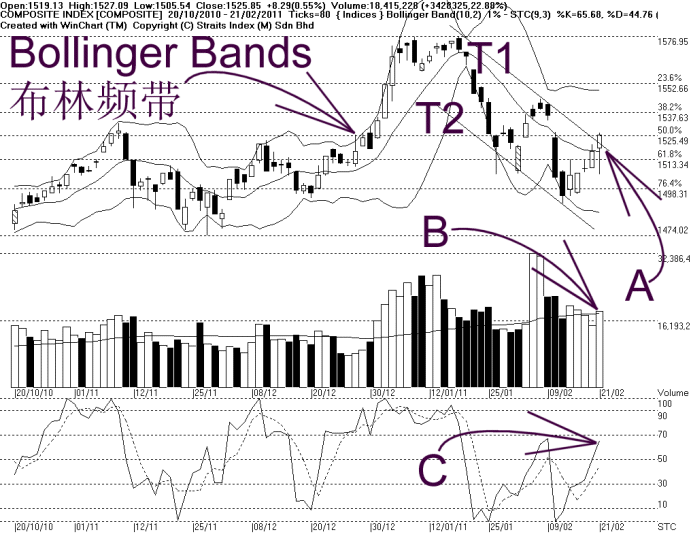
Meanwhile, the KLCI managed to break above the Bollinger Middle Band, thus bringing the immediate technical outlook back to the positive territory. However, the Bollinger Bands has not really expanded, and as a result, it has not really signaled any positive movement for the KLCI.
As indicated by B, total market volume rose 22.88%, with volume back on above the 40-day Volume Moving Average. This means that the market is well-participated, and if volume could stay above the 40-day Volume Moving Average, the market sentiment would likely to improve.
As indicated by C, the Stochastic continue rising, but it has not broken above 70%. If the Stochastic could break above 70%, it would enter the short term bullish territory, which is a positive signal for the KLCI.
In conclusion, the KLCI is now testing the T1 downtrend line as well as the 14, 21, 31 EMA dynamic resistance, and if the KLCI could take out these barrier, the technical outlook would turn positive.
Find this analysis useful? Why not share it with others? Click Here to send this to a friend
 1st Online Training In Malaysia |
 |
 |
 |
| View the Online Training | More Market Analysis | Find out more about WinChart | Upcoming Events |
Straits Index (M)
Sdn Bhd
No. 16, Jalan LP 1A / 5, Lestari Perdana,
43300 Seri Kembangan, Selangor
Hotline: (03) 8941 6828 (5
lines) Fax: (03) 8941 9828
Email: info@straitsindex.com
© Copyright 1997-2010 Straits Index (M) Sdn Bhd All
rights reserved