WinChart Technical Analysis
Daily Market Analysis
| We
are an approved Securities Industry Development Corporation (SIDC)-CPE Training Provider. the training and development arm of the Securities Commission Malaysia (SC). |
|||
 |
 |
||
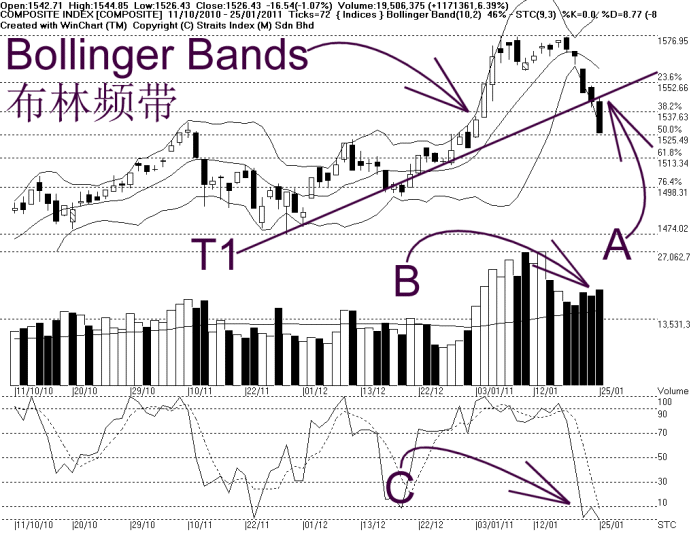
As indicated by A, the KLCI breaks below the 1537.63 WinChart Automatic Fibonacci Retracement, and therefore, the next support is at 1525.49%, 50% Fibonacci retracement line. Resistance would be at 1537.63.
As indicated by B, total market increased 6.39%, and stays above the 40-day Volume Moving Average. Market is still actively participated, despite the KLCI is falling. Generally, if volume is higher when market falls, it implies that the selling pressure is increasing.
As indicated by C, the Stochastic fall back to 0%, while staying in the short term bearish territory. This suggests that the market movement of the KLCI is still weak, until the Stochastic could successfully break above 30%.
As the KLCI breaks below the 31-day EMA as well as the T1 uptrend line, the technical outlook for the KLCI is turning negative. If the KLCI should failed to resume its positive above the T1 line or the 14, 21, 31 EMA, the risk of forming a downtrend would be higher.
Find this analysis useful? Why not share it with others? Click Here to send this to a friend
 1st Online Training In Malaysia |
 |
 |
 |
| View the Online Training | More Market Analysis | Find out more about WinChart | Upcoming Events |
Straits Index (M)
Sdn Bhd
No. 16, Jalan LP 1A / 5, Lestari Perdana,
43300 Seri Kembangan, Selangor
Hotline: (03) 8941 6828 (5
lines) Fax: (03) 8941 9828
Email: info@straitsindex.com
© Copyright 1997-2010 Straits Index (M) Sdn Bhd All
rights reserved