WinChart Technical Analysis
Daily Market Analysis
| We
are an approved Securities Industry Development Corporation (SIDC)-CPE Training Provider. the training and development arm of the Securities Commission Malaysia (SC). |
|||
 |
 |
||
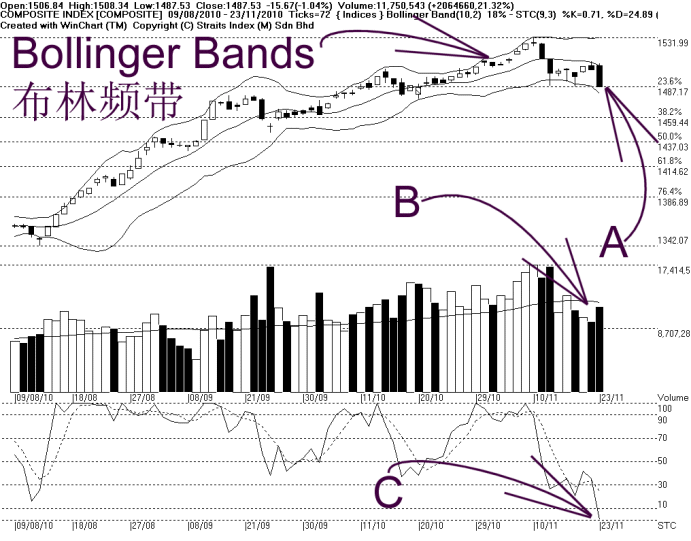
As shown on the chart above, the KLCI started falling after resisted by the Bollinger Middle Band yesterday. Together with the Bollinger Bands expanding, the Bollinger Bands is showing a bearish signal for the KLCI.
As indicated by B, total market volume increased 21.32%, as profit taking increases. This implies some increased of selling pressure, and usually have negative effect to the market sentiment.
As indicated by C, the Stochastic fell below 30%, entering the short term bearish region. Provided that the Stochastic is staying below 30%, the market movement for the short term is expected to be bearish bias.
In conclusion, the KLCI is turning weak as it breaks below the 14, 21, 31 EMA, thus violated its uptrend support. For now, technical outlook shall remain weak, unless the KLCI could break above the 14, 21, 31 EMA.
Find this analysis useful? Why not share it with others? Click Here to send this to a friend
 1st Online Training In Malaysia |
 |
 |
 |
| View the Online Training | More Market Analysis | Find out more about WinChart | Upcoming Events |
Straits Index (M)
Sdn Bhd
No. 16, Jalan LP 1A / 5, Lestari Perdana,
43300 Seri Kembangan, Selangor
Hotline: (03) 8941 6828 (5
lines) Fax: (03) 8941 9828
Email: info@straitsindex.com
© Copyright 1997-2010 Straits Index (M) Sdn Bhd All
rights reserved