WinChart Technical Analysis
Daily Market Analysis
| We
are an approved Securities Industry Development Corporation (SIDC)-CPE Training Provider. the training and development arm of the Securities Commission Malaysia (SC). |
|||
 |
 |
||
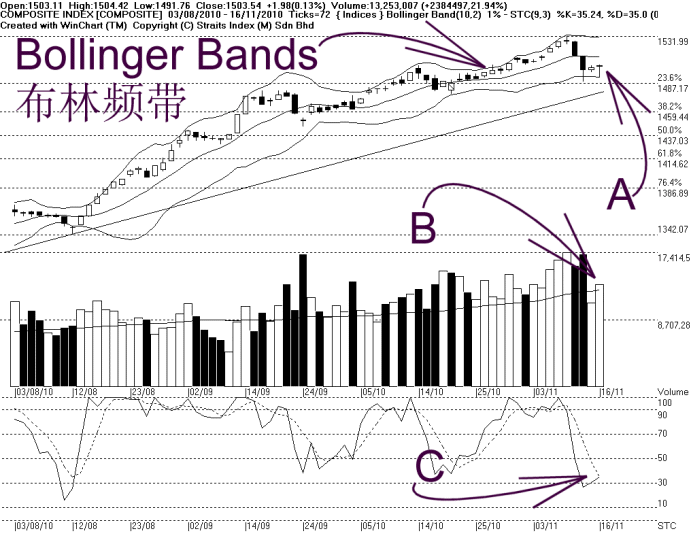
Meanwhile, the Bollinger Bands expanded 1%, with the KLCI below the Bollinger Middle Band. However, the expansion of the Bollinger Bands is insignificant, thus not able to show any bearish signal yet.
As indicated by B, total market volume increased 21.94%, with volume above the 40-day volume moving average. Generally, if volume should stay above the 40-day volume moving average, it is a positive sign. However, if the volume should increase with the KLCI falling, it would suggest an increase of selling pressure.
As indicated by C, the Stochastic rebounded, thus breaking above 30%, leaving the short term bearish territory. If the Stochastic should break and stay below 30%, it would be a short term bearish signal for the KLCI.
In short, the KLCI remains in a consolidation and the short term movement shall remains unclear. With the KLCI below the Bollinger Middle Band, the immediate technical outlook is towards the negative side. However, as the KLCI is still above the 14, 21, 31 EMA, the uptrend is not yet violated.
Find this analysis useful? Why not share it with others? Click Here to send this to a friend
 1st Online Training In Malaysia |
 |
 |
 |
| View the Online Training | More Market Analysis | Find out more about WinChart | Upcoming Events |
Straits Index (M)
Sdn Bhd
No. 16, Jalan LP 1A / 5, Lestari Perdana,
43300 Seri Kembangan, Selangor
Hotline: (03) 8941 6828 (5
lines) Fax: (03) 8941 9828
Email: info@straitsindex.com
© Copyright 1997-2010 Straits Index (M) Sdn Bhd All
rights reserved