WinChart Technical Analysis
Daily Market Analysis
| We
are an approved Securities Industry Development Corporation (SIDC)-CPE Training Provider. the training and development arm of the Securities Commission Malaysia (SC). |
|||
 |
 |
||
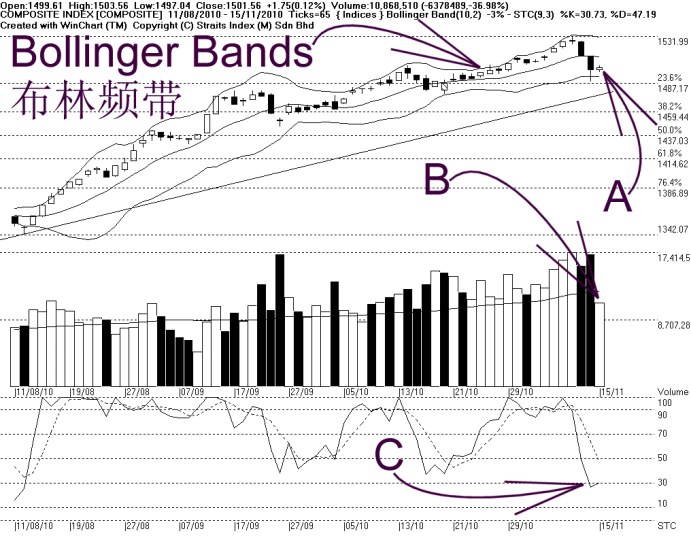
As shown on the chart above, the Bollinger Bands contracted 3%, and this suggests that the KLCI is still consolidating, and the consolidation is expected to carry on until the re-expansion of the Bollinger Bands.
As indicated by B, total market volume fell 36.98 %, with volume below the 40-day volume moving average. Usually, when the market is consolidating or when the direction is uncertain, trading volume will generally decline. But if volume should continue to stay low, the KLCI is less likely to pick up its strength.
As indicated by C, the Stochastic rebounded at 30%, and this means that the Stochastic does not trigger a short term bearish signal, and the short term movement for the KLCI is now still neutral.
In conclusion, the KLCI rebounded on Monday, and returned to above 1500 level, and with the Bollinger Bands contracting, the KLCI is expected to consolidate from here, and the consolidation shall carry on until the Bollinger Bands should re-expand.
Find this analysis useful? Why not share it with others? Click Here to send this to a friend
 1st Online Training In Malaysia |
 |
 |
 |
| View the Online Training | More Market Analysis | Find out more about WinChart | Upcoming Events |
Straits Index (M)
Sdn Bhd
No. 16, Jalan LP 1A / 5, Lestari Perdana,
43300 Seri Kembangan, Selangor
Hotline: (03) 8941 6828 (5
lines) Fax: (03) 8941 9828
Email: info@straitsindex.com
© Copyright 1997-2010 Straits Index (M) Sdn Bhd All
rights reserved