WinChart Technical Analysis
Daily Market Analysis
| We
are an approved Securities Industry Development Corporation (SIDC)-CPE Training Provider. the training and development arm of the Securities Commission Malaysia (SC). |
|||
 |
 |
||
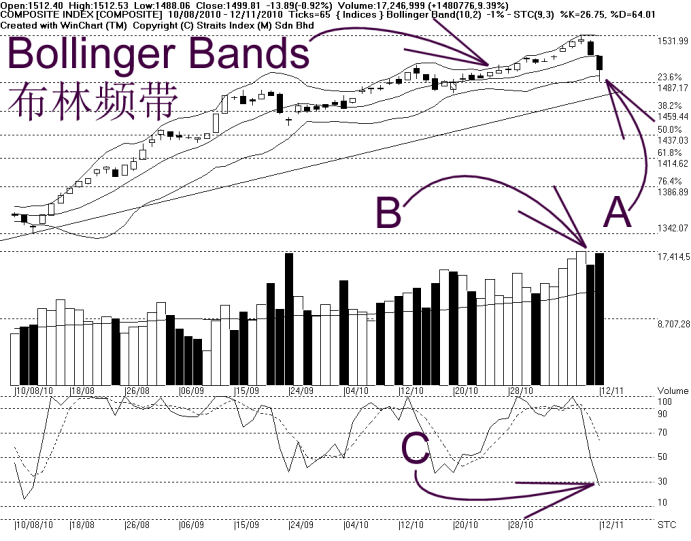
As shown on the chart above, the Bollinger Bands contracted 1%, suggesting that the KLCI is still consolidating or having its technical correction. However, with the KLCI now below the Bollinger Middle Band, the immediate technical outlook for the KLCI is on the negative side.
As indicated by B, total market volume increased 9.39%, with volume above the 40-day volume moving average. If volume should remain high while the KLCI is falling, it implies that the selling pressure is high, thus it would dampen the market sentiment.
As indicated by C, the Stochastic fell below 30% by margin, and if the Stochastic should stay below 30%, it would be a short term bearish signal for the KLCI. If the Stochastic could rebound and stay around 50% level, the short term movement of the KLCI is expected to be in a sideways manner.
In conclusion, profit taking pulled down the KLCI, but it is too soon to call for a downtrend formation, as the KLCI is still testing the 14, 21, 31 EMA.
Find this analysis useful? Why not share it with others? Click Here to send this to a friend
 1st Online Training In Malaysia |
 |
 |
 |
| View the Online Training | More Market Analysis | Find out more about WinChart | Upcoming Events |
Straits Index (M)
Sdn Bhd
No. 16, Jalan LP 1A / 5, Lestari Perdana,
43300 Seri Kembangan, Selangor
Hotline: (03) 8941 6828 (5
lines) Fax: (03) 8941 9828
Email: info@straitsindex.com
© Copyright 1997-2010 Straits Index (M) Sdn Bhd All
rights reserved