WinChart Technical Analysis
Daily Market Analysis
| We
are an approved Securities Industry Development Corporation (SIDC)-CPE Training Provider. the training and development arm of the Securities Commission Malaysia (SC). |
|||
 |
 |
||
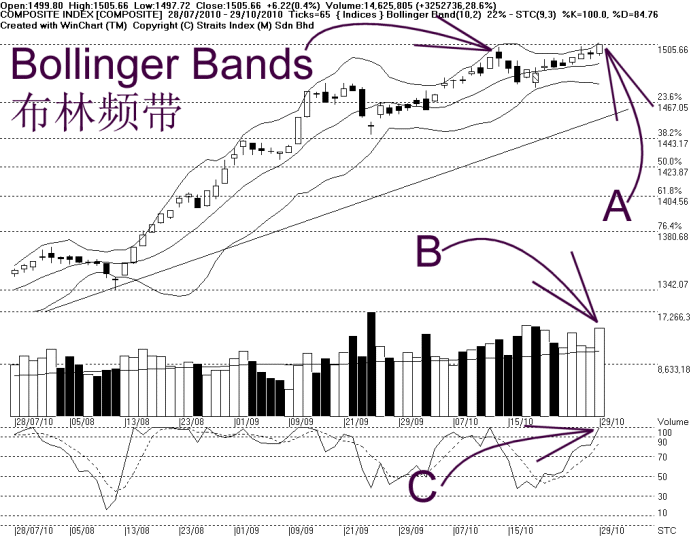
Meanwhile, the Bollinger Bands expanded 22%, with the KLCI above the Bollinger Middle Band, thus the Bollinger Bands is showing a bullish signal for the KLCI. If the Bollinger Bands should continue to expand while the KLCI above the Bollinger Middle Band, more upside room for the KLCI is likely.
As indicated by B, total market volume increased 28.6%, and therefore, volume is still firmly above the 40-day volume moving average. This shows that the market is actively participated, and the market sentiment in general is positive.
As indicated by C, the Stochastic remain above 70%, in the short term bullish region. Therefore, this suggests that the market movement for the short term is bullish bias.
Despite the Asian markets closing mostly lower, the KLCI remained it its uptrend, even breaking its resistance. The technical outlook for the KLCI is still positive, while the uptrend remain intact with the 14, 21, 31 EMA serving as the dynamic support.
Find this analysis useful? Why not share it with others? Click Here to send this to a friend
 1st Online Training In Malaysia |
 |
 |
 |
| View the Online Training | More Market Analysis | Find out more about WinChart | Upcoming Events |
Straits Index (M)
Sdn Bhd
No. 16, Jalan LP 1A / 5, Lestari Perdana,
43300 Seri Kembangan, Selangor
Hotline: (03) 8941 6828 (5
lines) Fax: (03) 8941 9828
Email: info@straitsindex.com
© Copyright 1997-2010 Straits Index (M) Sdn Bhd All
rights reserved