WinChart Technical Analysis
Daily Market Analysis
| We
are an approved Securities Industry Development Corporation (SIDC)-CPE Training Provider. the training and development arm of the Securities Commission Malaysia (SC). |
|||
 |
 |
||
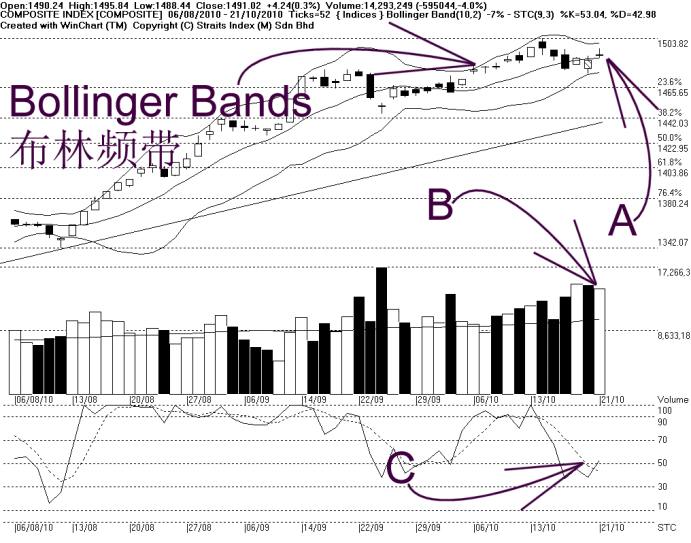
Meanwhile, the Bollinger Bands contracted 7%, suggesting that the KLCI is still at its consolidation stage. However, with the KLCI above the Bollinger Middle Band, the immediate technical outlook is gradually improving. If the Bollinger Bands should re-expand with the KLCI staying above the Bollinger Middle Band, the KLCI could have a good chance in testing, or even breaking above 1500.
As indicated by B, total market volume fell 4%, with volume still above the 40-day volume moving average. Generally, this suggests that the overall market sentiment is still on the positive side.
As indicated by C, the Stochastic breaks above 50%, showing some improvement in the short term movement for the KLCI. If the Stochastic could break above 70%, it would be a short term bullish signal for the KLCI.
In conclusion, the uptrend of the KLCI remains intact, and now that the KLCI is gradually regaining its position, the immediate technical outlook is set to improve, and the KLCI is expected to re-test the 1500 level again.
Find this analysis useful? Why not share it with others? Click Here to send this to a friend
 1st Online Training In Malaysia |
 |
 |
 |
| View the Online Training | More Market Analysis | Find out more about WinChart | Upcoming Events |
Straits Index (M)
Sdn Bhd
No. 16, Jalan LP 1A / 5, Lestari Perdana,
43300 Seri Kembangan, Selangor
Hotline: (03) 8941 6828 (5
lines) Fax: (03) 8941 9828
Email: info@straitsindex.com
© Copyright 1997-2010 Straits Index (M) Sdn Bhd All
rights reserved