WinChart Technical Analysis
Daily Market Analysis
| We
are an approved Securities Industry Development Corporation (SIDC)-CPE Training Provider. the training and development arm of the Securities Commission Malaysia (SC). |
|||
 |
 |
||
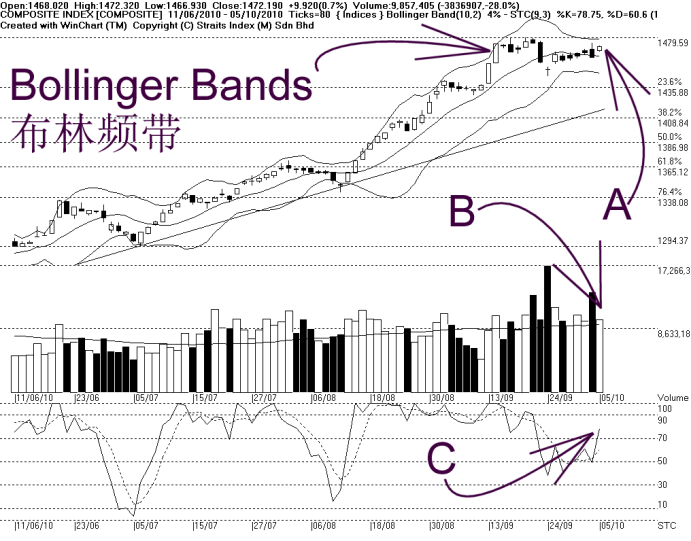
As shown on the chart above, the Bollinger Bands expanded 4%, with the KLCI above the Bollinger Middle Band, thus the Bollinger Bands is showing positive signals again, although the expansion was rather insignificant.
As indicated by B, total market volume reduced 28%, as the KLCI moves sideways, but volume is still above the 40-day VMA level, thus the market is still relatively active. In short, if the KLCI should sustain its uptrend, a healthy volume firmly above the 40-day VMA level is needed.
In conclusion, the slight re-expansion of the Bollinger Bands suggests that the immediate technical outlook for the KLCI is still on the positive side and if the KLCI could break above 1479.59, the next target would be the 1500 mark.
Find this analysis useful? Why not share it with others? Click Here to send this to a friend
 1st Online Training In Malaysia |
 |
 |
 |
| View the Online Training | More Market Analysis | Find out more about WinChart | Upcoming Events |
Straits Index (M)
Sdn Bhd
No. 16, Jalan LP 1A / 5, Lestari Perdana,
43300 Seri Kembangan, Selangor
Hotline: (03) 8941 6828 (5
lines) Fax: (03) 8941 9828
Email: info@straitsindex.com
© Copyright 1997-2010 Straits Index (M) Sdn Bhd All
rights reserved