WinChart Technical Analysis
Daily Market Analysis
| We
are an approved Securities Industry Development Corporation (SIDC)-CPE Training Provider. the training and development arm of the Securities Commission Malaysia (SC). |
|||
 |
 |
||
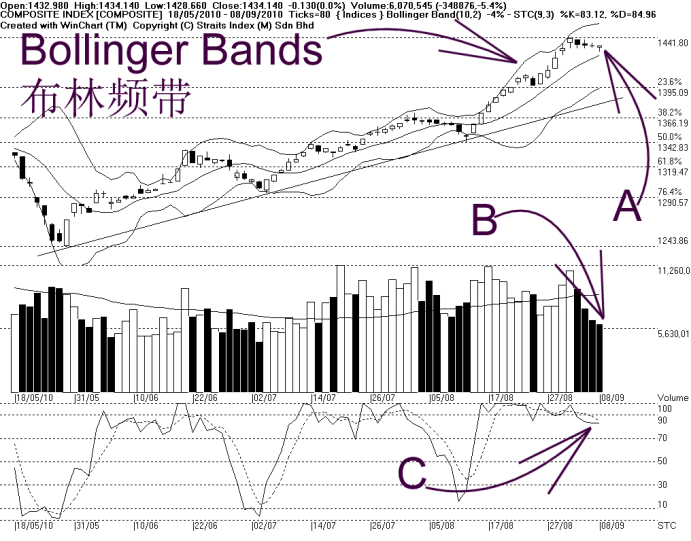
As shown on the chart above, the Bollinger Bands is still contracting, suggesting that the KLCI is consolidating, but the Bollinger Middle Band is the dynamic support for the KLCI, thus the immediate technical outlook is still on the positive side.
As indicated by B, total market volume fell another 5.4%, with volume below the 40-day VMA level. This shows that the market is relatively quiet as it is consolidating; investors are mostly on the sidelines.
As indicated by C, the Stochastic remains above 70%, in the short term bullish region. Thus suggesting that the short term movement of the KLCI is still bullish biased, unless the Stochastic should break below 70%.
In conclusion, the KLCI is still well-supported by blue chips component, despite technical correction is taking place in regional markets. Technically, provided that the KLCI is still above the Bollinger Middle Band, and the 14, 21, 31 EMA, the uptrend shall remain intact.
Find this analysis useful? Why not share it with others? Click Here to send this to a friend
 1st Online Training In Malaysia |
 |
 |
 |
| View the Online Training | More Market Analysis | Find out more about WinChart | Upcoming Events |
Straits Index (M)
Sdn Bhd
No. 16, Jalan LP 1A / 5, Lestari Perdana,
43300 Seri Kembangan, Selangor
Hotline: (03) 8941 6828 (5
lines) Fax: (03) 8941 9828
Email: info@straitsindex.com
© Copyright 1997-2010 Straits Index (M) Sdn Bhd All
rights reserved