WinChart Technical Analysis
Daily Market Analysis
| We
are an approved Securities Industry Development Corporation (SIDC)-CPE Training Provider. the training and development arm of the Securities Commission Malaysia (SC). |
|||
 |
 |
||
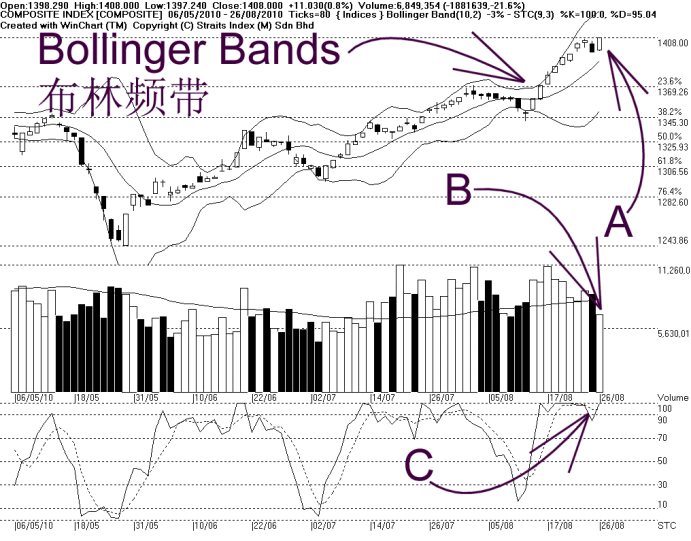
As shown on the chart above, the Bollinger Bands contracted 3%, suggesting that the KLCI might be consolidating. If the KLCI should consolidate, the market direction would be unclear, until the re-expansion of the Bollinger Bands.
As indicated by B, total market volume declined 21.6%, with volume falling below the 40-day VMA level. This suggests that most investors are being cautious while staying on the sidelines. If volume should stay low, the market is less likely to pick up its strength.
As indicated by C, the Stochastic is touching 100% again, signaling that the short term movement of the KLCI is over-heated again. Nevertheless, with the Stochastic above 70%, the market movement for the short term is still bullish biased.
In short, the KLCI returned to above 1400 level, but short term over-bought condition remains intact. The KLCI is likely to consolidate with the Bollinger Bands contracting but immediate technical outlook is still on the positive side.
Find this analysis useful? Why not share it with others? Click Here to send this to a friend
 1st Online Training In Malaysia |
 |
 |
 |
| View the Online Training | More Market Analysis | Find out more about WinChart | Upcoming Events |
Straits Index (M)
Sdn Bhd
No. 16, Jalan LP 1A / 5, Lestari Perdana,
43300 Seri Kembangan, Selangor
Hotline: (03) 8941 6828 (5
lines) Fax: (03) 8941 9828
Email: info@straitsindex.com
© Copyright 1997-2010 Straits Index (M) Sdn Bhd All
rights reserved