WinChart Technical Analysis
Daily Market Analysis
| We
are an approved Securities Industry Development Corporation (SIDC)-CPE Training Provider. the training and development arm of the Securities Commission Malaysia (SC). |
|||
 |
 |
||
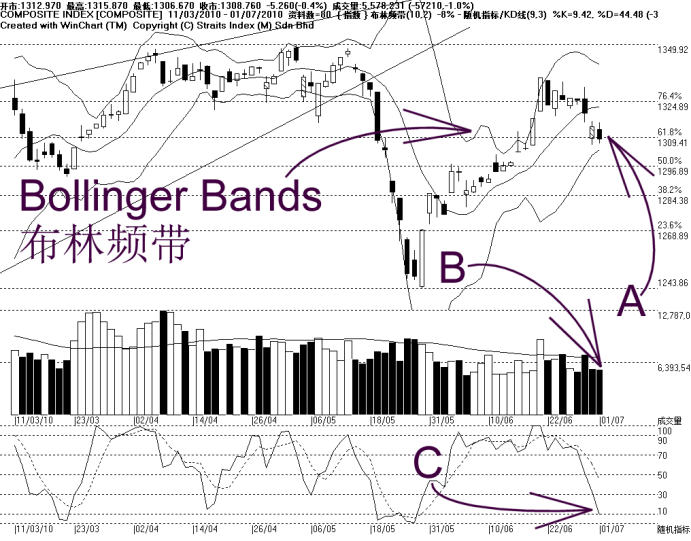
On Thursday, the KLCI was 5.26 points lower, due to the negative performance of the regional markets. As a result, the KLCI breaks below 1309 WinChart Automatic Fibonacci Retracement, as indicated by A, to close at 1308.76 points. Thus the immediate resistance is at 1309 WinChart Automatic Fibonacci Retracement while the support is at 1297 ~ 1300 level.
As shown on the chart above, the Bollinger Bands contracted 8%, suggesting that the KLCI is still consolidating, thus the market direction is still unclear. With the KLCI below the Bollinger Middle Band, the immediate technical outlook is expected to be on the weaker side.
As indicated by B, total market volume declined 1%, while still below the 40-day VMA level. This shows that the market is indeed very quiet, thus the KLCI is less likely to pick up its strength.
As indicated by C, the Stochastic fell below 30%, entering the short term bearish territory. If the Stochastic should stay below 30%, the market movement for the short term is expected to be weak.
With the KLCI breaking below the 14, 21, 31 EMA, the immediate technical outlook is now turning negative. If the Bollinger Bands should re-expand with the KLCI below the Bollinger Middle Band, it would signal a bearish movement for the KLCI.
Find this analysis useful? Why not share it with others? Click Here to send this to a friend
 1st Online Training In Malaysia |
 |
 |
 |
| View the Online Training | More Market Analysis | Find out more about WinChart | Upcoming Events |
Straits Index (M)
Sdn Bhd
No. 16, Jalan LP 1A / 5, Lestari Perdana,
43300 Seri Kembangan, Selangor
Hotline: (03) 8941 6828 (5
lines) Fax: (03) 8941 9828
Email: info@straitsindex.com
© Copyright 1997-2010 Straits Index (M) Sdn Bhd All
rights reserved