WinChart Technical Analysis
Daily Market Analysis
| We
are an approved Securities Industry Development Corporation (SIDC)-CPE Training Provider. the training and development arm of the Securities Commission Malaysia (SC). |
|||
 |
 |
||
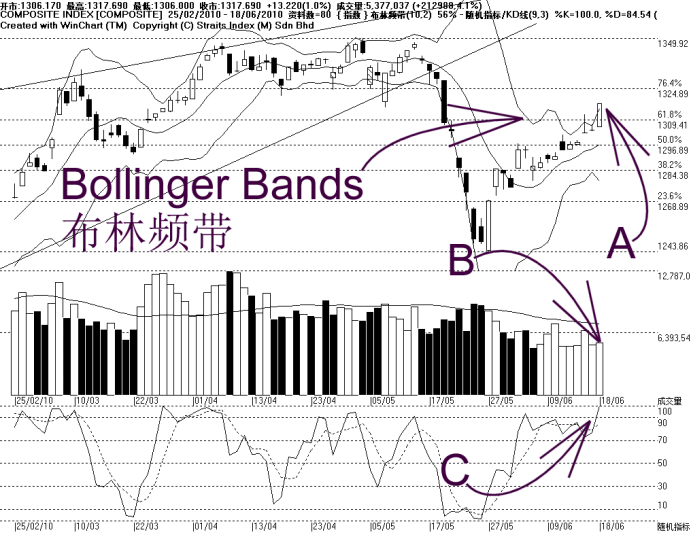
As indicated by A, the Bollinger Bands re-expanded 56%, with the KLCI above the Bollinger Middle Band. The KLCI gained 13.22 points to close at 1317.69 points, breaking above the 1309.41 WinChart Automatic Fibonacci Retracement. Next resistance for the KLCI is at 1324.89 WinChart Automatic Fibonacci Retracement while the immediate support is at 1309.41 WinChart Automatic Fibonacci Retracement.
Meanwhile, the KLCI is still staying above the 14, 21, 31 EMA, thus the immediate technical outlook is still on the positive side. The 14, 21, 31 EMA shall also serve as the dynamic support for the KLCI.
As indicated by B, total market volume only increased 4.1%, despite the KLCI gaining over 10 points. This suggests that the market is still quiet, and the gains were only selective. Nevertheless, if volume should pick up and break above the 40-day VMA level, it would lift the market sentiment.
As indicated by C, the Stochastic stays above 70%, in the short term bullish territory. Therefore, this suggests that the KLCI short term movement is still bullish biased, and the bullishness is expected to carry on until the Stochastic should break below 70%.
Technically, the KLCI is showing some positive signs, but total market volume failed to confirm the positive signal. Nevertheless, with the KLCI staying above the 14, 21, 31 EMA as well as the Bollinger Middle Band, the current technical outlook is on the positive side.
Find this analysis useful? Why not share it with others? Click Here to send this to a friend
 1st Online Training In Malaysia |
 |
 |
 |
| View the Online Training | More Market Analysis | Find out more about WinChart | Upcoming Events |
Straits Index (M)
Sdn Bhd
No. 16, Jalan LP 1A / 5, Lestari Perdana,
43300 Seri Kembangan, Selangor
Hotline: (03) 8941 6828 (5
lines) Fax: (03) 8941 9828
Email: info@straitsindex.com
© Copyright 1997-2010 Straits Index (M) Sdn Bhd All
rights reserved