WinChart Technical Analysis
Daily Market analysis
| We
are an approved Securities Industry Development Corporation (SIDC)-CPE Training Provider. the training and development arm of the Securities Commission Malaysia (SC). |
|||
 |
 |
||
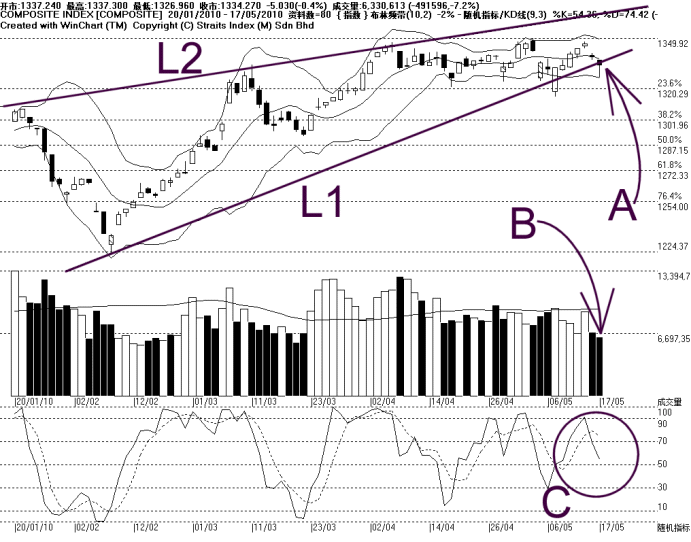
The KLCI breaks below the T2 line during intra-day trading, as lead by the negative performance of the Dow Jones Industrial Average Index last Friday. As indicated by A, the KLCI retested the L2 line at the closing of the market, and therefore, the break out is yet to be confirmed.
Meanwhile, the Bollinger Bands continue to contract, contracted 2%, suggesting that the KLCI is actually still consolidating while the market direction is still unclear. But with the KLCI now below the Bollinger Middle Band, the immediate technical outlook is on the negative side.
As indicated by B, total market volume declined 7.2% with market volume below the 40-day VMA level. This again suggests that the market is quiet as investors confidence is still relatively low, and therefore, the KLCI is less likely to gain strength.
As circled at C, the Stochastic breaks below 70%, suggesting that the short term bullish signal has ended, and a beginning of a technical correction. If the Stochastic should stay below 70%, the short term movement of the KLCI is expected to be weakening. But with the Bollinger Bands narrowing, the KLCI is expected to fluctuate in narrow range.
In conclusion, the KLCI is affected by the external market performance, and technically, the consolidation remains intact, until the re-expansion of the Bollinger Bands, then only a new movement shall begin.
Find this analysis useful? Why not share it with others? Click Here to send this to a friend
 1st Online Training In Malaysia |
 |
 |
 |
| View the Online Training | More Market Analysis | Find out more about WinChart | Upcoming Events |
Straits Index (M)
Sdn Bhd
No. 16, Jalan LP 1A / 5, Lestari Perdana,
43300 Seri Kembangan, Selangor
Hotline: (03) 8941 6828 (5
lines) Fax: (03) 8941 9828
Email: info@straitsindex.com
© Copyright 1997-2010 Straits Index (M) Sdn Bhd All
rights reserved